Glossary
The following is a set of mathematical terms with examples that students will explore during the 6th, 7th, and 8th grades.
A - C | D - F | G - I | J - L | M - O | P - R | S - U | V - Z
A
Absolute value
The absolute value of a number is its distance from 0 on the number line. Numbers that are the same distance from 0 have the same absolute value of 3.
Abundant number
A nmber for which the sum of all its proper factors is greater than the number itself. For example, 24 is an abundant number because the sum of its proper factor is 36; 1 + 2 + 3 + 4 + 6 + 8 + 12 = 36.
Acute triangle
An acute triangle is a triangle with three acute angles.

Additive identity
Zero is the additive identity for rational numbers. Adding zero to any rational number results in a sum identical to the original rational number. For any rational number a, 0 + a = a. For example, 0 + 4.375 = 4.375.
Additive inverses
Two numbers, a and b, that satisfy the equation a + b = 0. For example, 3 and -3 are additive inverses, and 1/2 and -1/2 are additive inverses.
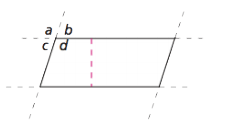
Adjacent angles
Two angles in a plane that share a common vertex and common side but do not overlap are adjacent angles. In the parallelogram below, a and b are adjacent angles. Other pairs of adjacent angles are a and c, b and d, and c and d.
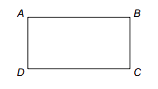
Adjacent sides
Two sides that meet at a vertex. In this rectangle, sides AB and AD are adjacent because they meet at vertex A.
Algorithm
A set of rules for performing a procedure. Mathematicians invent algorithms that are useful in many kinds of situations. Some examples of algorithms are the rules for long division or the rules for adding two fractions.
Sample algorithm: To add two fractions, first change them to equivalent fractions with the same denominator. Then add the numerators and put the sum over the common denominator.
Analyze (Academic Vocabulary)
To think about and understand facts and details about a given set of information. Analyzing can involve providing a written summary supported by factual information, a diagram, chart, table, or a combination of these.
Related terms:
examine, evaluate, determine, observe, investigate
Sample: Analyze the following data to find the mean and the mode.
| Student | Krista | Mike | Lupe | Kareem |
|---|---|---|---|---|
| Time (min) | 10 | 15 | 20 | 10 |
Angle
The figure formed by two rays or line segments that have a common vertex. Angles are measured in degrees. The sides of an angle are rays that have the vertex as a starting point. Each of the three angles below is formed by the joining of two rays. The angle at point A on the triangle below is identified as angle BAC or ∠BAC.

Angle of rotation
The number of degrees that a figure rotates.
Angle ruler
r An angle ruler is a tool with two transparent arms, linked by a rivet that allows them to swing apart to form angles of various sizes. One arm is marked with a circular ruler showing degree measures from 0° to 360°. A goniometer is one type of angle ruler.
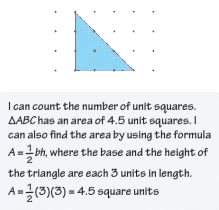
Area
The measure of the amount of surface enclosed by the boundary of a figure. To find the area A of a figure, you can count how many unit squares it takes to cover the figure. You can find the area of a rectangle by multiplying the length by the width. This is a shortcut method for finding the number of unit squares it takes to cover the rectangle. If a figure has curved or irregular sides, you can estimate the area. Cover the surface with a grid and count whole grid squares and parts of grid squares. When you find the area of a shape, write the units, such as square centimeters (cm2 ), to indicate the unit square that was used to find the area.
Area model
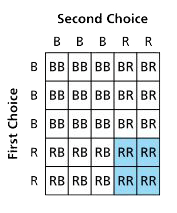
A diagram primarily used in probability situations in which fractions of the area of the diagram correspond to probabilities. For example, suppose there are three blue blocks and two red blocks in a container. If one block is drawn out at a time, and the block drawn each time is replaced, the area model below shows that the probability of getting two red blocks is 4/25. Area models are particularly helpful when the outcomes being analyzed are not equally likely, because more likely outcomes take up larger areas. Area models are also helpful for outcomes involving more than one stage, such as rolling a number cube and then tossing a coin.
Arithmetic sequence
e A number sequence formed by adding a fixed number to each previous term to find the next term. The fixed number is called the common difference. For example 4, 7, 10, 13, . . .
Attribute
An attribute is a characteristic or feature that is being investigated.
Average speed
The number of miles per hour averaged over an entire trip. For instance, if you travel 140 miles in 2 hours, then the average speed is 70 miles per hour.
topB
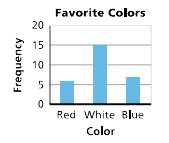
Bar graph
A graphical representation of a table of data in which the height or length of each bar indicates its frequency. The bars are separated from each other to highlight that the data are discrete or “counted” data. In a vertical bar graph, the horizontal axis shows the values or categories, and the vertical axis shows the frequency for each of the values or categories. In a horizontal bar graph, the vertical axis shows the values or categories, and the horizontal axis shows the frequencies.
 Base
Base
The number that is raised to a power in an exponential expression. In the expression 35 , read “3 to the fifth power”, 3 is the base and 5 is the exponent.
Base of a three-dimensional figureCorrelation coefficient
The face of a three-dimensional shape chosen to be the “bottom” face.
As students advance into 7th grade, they will see that base(s) can also mean the two opposite faces of a three-dimensional shape that are parallel and congruent. For a pyramid or a cone, the base is the face opposite the vertex.
Base of a two-dimensional figure
See measurements of two-dimensional figures.
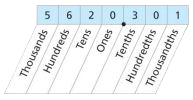
Base ten numeration
The common system of writing w hole numbers and decimal fractions using digits 0, 1, 2, 3, 4, 5, 6, 7, 8, and 9 and place values that are powers of 10. For example, the base ten numeral 5620.301 represents 5000 + 600 + 20 + 0 + 3/10 + 0/100 + 1/1000.
Basic design element
A part of a pattern or design that, when transformed using at least one type of symmetry transformation, will produce the entire design.
Benchmark
A reference number that can be used to estimate the size of other numbers. For work with fractions, 0, 1/2 , and 1 are good benchmarks. We often estimate fractions or decimals with benchmarks because it is easier to do arithmetic with them, and estimates often give enough accuracy for the situation. For exampl e, many fractions and decimals—such as 37/50 , 5/8 , 0.43, and 0.55—can be thought of as being close to 1/2 . You might say 5/8 is between 1/2 and 1 but closer to 1/2 , so you can estimate 5/8 to be about 1/2 . We also use benchmarks to help compare fractions and decimals. For example, we could say that 5/8 is greater than 0.43 because 5/8 is greater than 1/2 and 0.43 is less than 1/2 .
Binomial
An algebraic expression that is the sum or difference of two terms. The expression 2x + 4 is a binomial.
Binomial probability
The probability of getting one of two possible outcomes over many trials. For example, the probability of getting a heads or tails when tossing a coin or the probability of getting a 5 or not 5 when rolling a number cube.
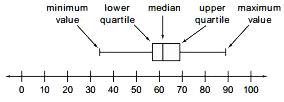
Box-and-whisker plot, or box plot
A display that shows the distribution of values in a data set separated into four equal-size groups. A box plot is constructed from a five-number summary of the data.
top
C
Capture-tag-recapture method
A sampling method used to estimate the size of a wildlife population. When using this method, scientists take a sample of animals, mark them in some way, then release them back into their habitat. Later, they capture another sample and count how many animals in that sample are marked. They use these data to estimate the population size.
Categorical data
Non-numerical data sets are categorical. For example, the responses to “What month were you born?” are categorical data. Frequency counts can be made of the values for a given category. The table below shows examples of categories and their possible values.
| Category | Possible Values |
|---|---|
| Month people are born | January, February, March |
| Favorite color to wear | magenta, blue, yellow |
| Kinds of pets people have | cats, dogs, fish, horses |
Categorical variables
Variables that measure characteristics using words that represent possible responses within a given category. Frequency counts can be made of the values for a given category. The table below shows examples of categories and their possible values.
| Category | Possible Values |
|---|---|
| Month people are born | January, February, March |
| Favorite color to wear | magenta, blue, yellow |
| Kinds of pets people have | cats, dogs, fish, horses |
Census
Data collected from every individual in a population.
Center of rotation
A fixed point about which a figure rotates.
Change
To become different. For example, temperatures rise and fall, prices increase and decrease, and so on. In mathematics, quantities that change are called variables.
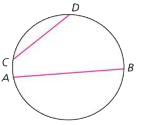
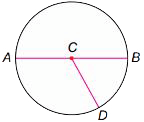
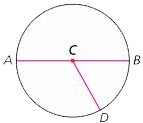
Chord
A line segment with endpoints on a circle. Segments CD and AB in the diagram below are chords.
Circle
A two-dimensional figure in which every point is the same distance from a point called the center . Point C is the center of this circle.
Circumference
The distance around (or perimeter of) a circle. It takes slightly more than three diameters to match the circumference of a circle. More formally, the circumference of a circle is pi ( π ) times the diameter of the circle.
Cluster
A group of numerical data values that are close to one another. For example, consider the data set 2, 2, 2, 2, 3, 3, 7, 7, 8, 9, 10, 11. There is a cluster of data values at 2 (or from 2 to 3) and a gap between data values 3 and 7.
Coefficient
A number that is multiplied by a variable in an equation or expression. In a linear equation of the form y = mx + b , the number m is the coefficient of x as well as the slope of the line. For example, in the equation y = 3x + 5, the coefficient of x is 3. This is also the slope of the line.
Commission
The amount earned, based on the percent of total sales. For example, a car salesperson who earns 10% on car sales and sells $60,000 worth of cars would earn a commission of $6,000 (10% of $60,000).
Common factor
A factor that two or more numbers share. For example, 7 is a common factor of 14 and 35 because 7 is a factor of 14 (14 = 7 x 2) and 7 is a factor of 35 (35 = 7 x 5).
Common multiple
A multiple that two or more numbers share. For example, the first few multiples of 5 are 5, 10, 15, 20, 25, 30, 35, 40, 45, 50, 55, 60, 65, and 70. The first few multiples of 7 are 7, 14, 21, 28, 35, 42, 49, 56, 63, 70, 77, 84, 91, and 98. From these lists, we can see that two common multiples of 5 and 7 are 35 and 70.
Commutative property
The order of the addition or multiplication of two numbers does not change the result. For two numbers a and b, a + b = b + a and a x b = b x a. For example, 3/7 + 8 = 8 + 3/7 and 3/7 x 8 = 8 x 3/7
Commutative property of addition
A mathematical property that states that the order in which quantities are added does not matter. It states that a + b = b + a for any two real numbers a and b. For example, 5 + 7 = 7 + 5 and 2x + 4 = 4 + 2x.
Commutative property of multiplication
A mathematical property that states that the order in which quantities are multiplied does not matter. It states that ab = ba for any two real numbers a and b. For example, 5 x 7 = 7 x 5 and 2y(4) = (4)2y.
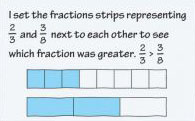
Compare (Academic Vocabulary)
To tell or show how two things are alike or different.
Related terms:
analyze, relate, resemble
Sample: Compare the fractions 2/3 and 3/8.
Complementary angles
Complementary angles are a pair of angles whose measures add to 90°.
Completing the square
The process of writing any given quadratic expression in equivalent form a(x – b)2 + c. Completing the square turns every quadratic equation into the form (x – p)2 = q.
Complex conjugates
Number pairs in the form a + bi and a - bi are complex conjugates.
Complex numbers
The set of numbers that can be written in the form a + b i where a and b are real numbers and i is the number whose square is -1. 7, 6 + i , and -2i are examples of complex numbers.
Composite number
A whole number with factors other than itself and 1 (that is, a whole number that is not prime). Some composite numbers are 6, 15, 20, and 1,001.
Compound event
An event that consists of two or more simple events. For example, tossing a coin is a simple event. Tossing two coins, and examining combinations of outcomes, is a compound event.
Compound growth
Another term for exponential growth, usually used when talking about the monetary value of an investment. The change in the balance of a savings account shows compound growth because the bank pays interest not only on the original investment, but on the interest earned.
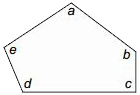
Concave polygon
A concave polygon is a polygon with at least one interior angle whose measure is greater than 180°. The concave polygon shown below has one interior angle that measures 258°.

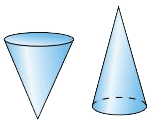
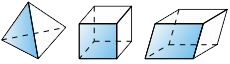
Cone
A three-dimensional shape with a circular base and a vertex opposite the base.
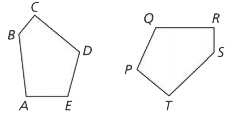
Congruent figures
Two figures are congruent if one is an image of the other under a translation, a reflection, a rotation, or some combination of these transformations. Put more simply, two figures are congruent if you can slide, flip, or turn one figure so it fits exactly on the other. The polygons below are congruent.
Conjecture
A claim about a pattern or relationship based on observations.
Consecutive numbers
Whole numbers in sequence that follow each other, such as 31, 32, 33 or 52, 53, 54.
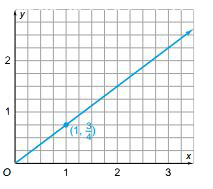
Constant of proportionality
The constant ratio of two proportional quantities, x and y ; usually written as y = kx , where k is the constant of proportionality. For example, in the equation y = 3/4x , the constant of proportionality is 3/4 . The graph is shown below.
Constant term
A number in an equation or algebraic expressions that is not multiplied by a variable, or an amount added to or subtracted from the terms involving variables. In an equation of the form y = mx + b , the y-intercept, b , is a constant term. The effect of the constant term on a graph is to raise or lower the graph. The constant term in the equation y = 3x + 5 is 5. The graph of y = 3x is raised vertically 5 units to give the graph of y = 3x + 5. In the expanded form of a quadratic expression, ax2 + bx + c, the constant term is the number c. The constant term in the expression -16t2 + 64t + 7 is 7. The constant term in the expression x2 – 4 is -4.
Convenience sampling
Choosing a sample because it is co nvenient. For example, if you ask all the students on your bus how long it takes them to get to school and then claim that these data are representative of the entire school population, you are surveying a convenience sample.
Convex polygon
A convex polygon is a polygon with all interior angles measuring less than 180°.
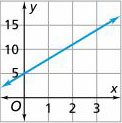
Coordinate graph
A graphical representation of pairs of related numerical values that shows the relationship between two variables. It relates the independent variable (shown on the x -axis) and the dependent variable (shown on the y -axis).
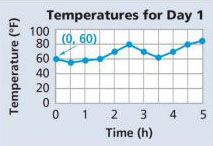
Coordinates (or coordinate pair)
An ordered pair of numbers used to locate a point on a coordinate grid. The first number in a coordinate pair is the value for the x -coordinate, and the second number is the value for the y -coordinate. A coordinate pair for the graph shown below is (0, 60).
Correlation coefficient
A measure of the strength of a linear relationship between two variables using a decimal number between -1 and 1.
Corresponding angles
Corresponding angles have the same relative position in similar figures. In this pair of similar shapes, angle BCD corresponds to angle JKF .

Corresponding sides
Corresponding sides have the same relative position in similar figures. In the pair of similar shapes above, side AB corresponds to side HJ .
Counterexample
An example that disproves a claim. If someone claims that a pattern is true for all cases, you only need to find one counterexample to disprove that claim.
Cube
A three-dimensional shape with six identical square faces. A cube is also a right rectangular prism.

Cube root
If A = s3 , then s is the cube root of A. For example, 2 is the cube root of 8 because 2 x 2 x 2 = 8. The 3√ symbol is used to denote the cube root.

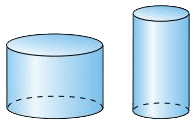
Cylinder
A three-dimensional shape with two opposite faces that are parallel and congruent circles. The side (lateral surface) is a rectangle that is “wrapped around” the circular faces at the ends.
top
D
Data
Values such as counts, ratings, measurements, or opinions that are gathered to answer questions. The table below shows data for mean temperatures in three cities.
Daily Mean Temperatures
| City | Mean Temperature (F) |
|---|---|
| Mobile, AL | 67.5 |
| Boston, MA | 51.3 |
| Spokane, WA | 47.3 |
Decay factor
The constant factor that each value in an exponential decay pattern is multiplied by to get the next value. The decay factor is the base in an exponential decay equation, and is a number between 0 and 1. For example, in the equation A = 64(0.5)n , where A is the area of a ballot and n is the number of cuts, the decay factor is 0.5. It indicates that the area of a ballot after any number of cuts is 0.5 times the area after the previous number of cuts. In a table of (x, y) values for an exponential decay relationshi p (with x-values increasing by 1), the decay factor is the ratio of any y-value to the previous y-value.
Decat rate
The percent decrease in an exponential decay pattern. In general, for an exponential pattern with decay factor b, the decay rate is 1 – b.
Decide
Academic Vocabulary To use the given information and related facts to find a value or make a determination.
Related terms:
determine, find, conclude
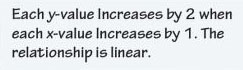
Sample: Study the pattern in the table. Decide whether the relationship is linear
or exponential.
| x | -1 | 0 | 1 | 2 | 3 |
|---|---|---|---|---|---|
| y | -9 | -7 | -5 | -3 | -1 |
Decimal
a fraction written in base ten numeration. For example, the fraction 375 / 1000 = 0.375 because 375/1000 = 3/10 + 7/100 + 5/1000.
Deficient number
A number for which the sum of all its proper factors is less than the number itself. For example, 14 is a deficient number because its proper factors, 1, 2, and 7, add to 10. All prime numbers are deficient.
Degree
A unit of measure of angles is also equal to 1/360 of a complete circle. The angle below measures about 1 degree (1°); 360 of these would just fit around a point and fill in a complete circle; 90 of them make a right angle.
Degree of a polynomial
The highest power of the variable in monomial terms of the expression.
Denominator
The number written below the line in a fraction. In the fraction 3/4 , 4 is the denominator. In the part-whole interpretation of fractions, the denominator shows the number of equal-size parts into which the whole has been split.
Dependent variable
One of the two variables in a relationship. Its value depends upon or is determined by the other variable, called the independent variable. For example, the cost of trail mix (dependent variable) depends on how much you buy (independent variable).
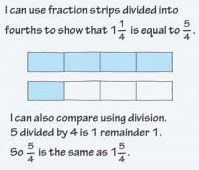
Describe (Academic Vocabulary)
To explain or tell in detail. A written description can contain facts and other information needed to communicate your answer. A diagram or a graph may also be included.
Related terms:
express, explain, illustrate, present
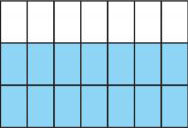
Sample: Describe in writing or with pictures how 5/4 compares to 1 1/4 .
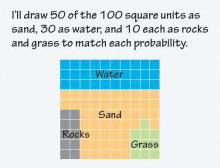
Design (Academic Vocabulary)
To make using specific criteria.
Related terms:
draw, plan, outline, model.
Sample: A computer game randomly hides a treasure chest. The probability that the treasure chest will be hidden in the sand is 50%, in the water 30%, in the rocks 10%, or in the grass 10%. Design a computer screen for this game
Determine (Academic Vocabulary)
To use the given information and any related facts to find a value or make a decision.
Related terms:
decide, find, calculate, conclude, solve, evaluate, examine
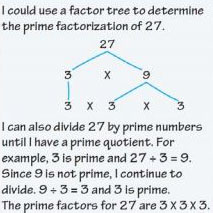
Sample: What is one way to determine the prime factorization of 27?
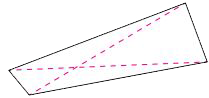
Diagonal
A line segment connecting two nonadjacent vertices of a polygon. All quadrilaterals have two diagonals as shown below. The two diagonals of a square are equal in length, and the two diagonals of a rectangle are equal in length. A pentagon has five diagonals. A hexagon has nine diagonals.
Diameter
A segment that goes from one point on a circle through the center of the circle to another point on the circle. Also, diameter is used to indicate the length of this segment. In this circle, segment AB is a diameter.
Difference of squares
An expression of the form a2 – b2 . It can be factored as (a + b)(a – b).
Dilation
A transformation that enlarges or reduces a figure by a scale factor about a center point so that the original figure and its image are similar. If the scale factor is greater than 1, the dilation is an enlargement. If the scale factor is less than 1, the dilation is a reduction.
Distribution
The entire set of collected data values, organized to show their frequency of occurrence. A distribution can be described using summary statistics and/or by referring to its shape.
Distributive property
A mathematical property used to rewrite expressions involving addition and multiplication. The Distributive Property states that for any three numbers a, b, and c, a (b + c) = ab + ac. If an expression is written as a factor multiplied by a sum, you can use the Distributive Property to multiply the factor by each term in the sum.
4(5 + x) = 4(5) + 4(x) = 20 + 4x
If an expression is written as a sum of terms and the terms have a common factor, you can use the Distributive Property to rewrite the expression as the common factor multiplied by a sum. This process is called factoring.
20 + 4x = 4(5) + 4(x) = 4(5 + x)
Dividend
The name for the number into which you are dividing in a division problem. For example, 26.5 is the dividend in the problem 26.5 ÷ 4.
Divisor
a) A number that divides a given number leav ing a zero remainder. For example, 5 is a divisor of 20 since 20 ÷ 5 = 4 has a remainder of 0. A divisor of a given number is also known as a factor of that number. Another way to determine if 5 is a divisor of 20 is to ask whether there is a whole number that, when multiplied by 5, gives 20. The number is 4: 5 x 4 = 20.
b) The name for the number by which you are dividing in a division problem. For example, 4 is the divisor in the problem 26.5 ÷r; 4.
Domain (of a relation or a function)
The set of possible values for the input or independent variable.
topE
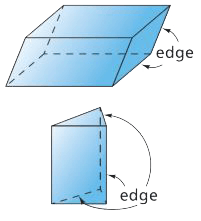
Edge
A line segment formed where two faces of a three-dimensional shape meet.
Equally likely
Two or more events that have the same probability of occurring. For example, when you toss a fair coin, heads and tails are equally likely; each has a 50% chance of happening. Rolling a six-sided number cube gives a 1/6 probability for each number to come up. Each outcome is equally likely.
Equation
A rule containing variables that represents a mathematical relationship. An example is the formula for finding the area of a circle, A = πr2 , or the equation 2/7 = x/42 .
Equivalent fractions
Fractions that are equal in value, but may have different numerators and denominators. For example, 2/3 and 14/21 are equivalent fractions. The shaded part of this rectangle represents both 2/3 and 14/21.
Equivalent ratios
Ratios whose fraction representations are equivalent are called equivalent ratios. For instance, the ratios 3 to 4 and 6 to 8 are equivalent because 3/4 = 6/8.
Estimate (Academic Vocabulary)
To find an approximate answer that is relatively close to an exact amount.
related terms:
approximate, guess
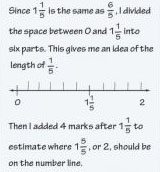
Sample: Estimate and mark where the number 2 should be on the number line below. Explain.
Even number
A multiple of 2. When you divide an even number by 2, the remainder is 0. Examples of even numbers are 0, 2, 4, 6, 8, and 10.
Expanded form (expression)
The form of an expression made up of sums or differences of terms rather than products of factors. The expressions 20 + 30, 5(4) + 5(21), x2 + 7x + 12, and x2 + 2x are in expanded form. The expanded form of a decimal number shows the place value of each digit.
For example, the expanded form of 324.05 is 3(100) + 2(10) + 4(1) + 5( 1/100 ).
Expanded form (number)
See prime factorization.
Expect (Academic Vocabulary)
To use theoretical or experimental data to anticipate a certain outcome.
Related terms:
anticipate, predict
Sample: Cynthia counted her sit-ups. Based on her data, how many sit-ups would you expect her to do in 40 seconds? Would you expect this pattern to continue indefinitely?
| Seconds | 10 | 20 | 30 |
|---|---|---|---|
| Number of Sit Ups | 6 | 12 | 18 |
Cynthia's sit-ups increased by 6 every 10 seconds. Since 40 seconds is 10 more seconds than 30, I expect her to do 18 + 6 = 24 sit-ups. I can also make a graph to represent this.
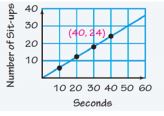
The graph shows 24 sit-ups at 40 seconds. I would not expect this pattern to continue because Cynthia will get tired and probably do fewer sit-ups.
Expected value (or long-term average)
Intuitively, the average payoff over the long run. For example, suppose you are playing a game with two number cubes. You score 2 points when a sum of 6 is rolled, 1 point for a sum of 3, and 0 points for anything else. If you roll the cubes 36 times, you could expect to roll a sum of 6 five times, a sum of 3 twice, and the other sums 29 times. This means that you could expect to score (5 x 2) + (2 x 1) + (29 x 0) = 12 points for 36 rolls, an average of 12/36 = 1/3 point per roll. Here, 1/3 is the expected value, or long-term average, of one roll.
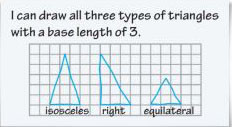
Experiment (Academic Vocabulary)
To try several different or new ways to discover something unknown or to demonstrate something known.
Related terms:
explore, examine, discover
Sample: Experiment to see if you can draw an isosceles, a right, and an equilateral triangle with the same base length.
Experimental probability
A probability that is determined through experimentation. For example, you could find the experimental probab ility of getting a head when you toss a coin by tossing a coin many times and keeping track of the outcomes. The experimental probability would be the ratio of the number of heads to the total number of tosses, or trials. Experimental probability may not be the same as the theoretical probability. However, for a large number of trials, they are likely to be close. Experimental probabilities are used to predict behavior over the long run.
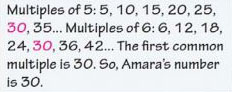
Explain (Academic Vocabulary)
To give facts and details that make an idea easier to understand. Explaining can involve a written summary supported by a diagram, chart, table, or a combination of these.
Related terms:
analyze, clarify, describe, justify, tell, show, present
Sample: Amara is thinking of a number that is the least common multiple of 5 and 6. What is the number? Explain your reasoning.
Exponent
The small raised number that tells how many times a factor is used. For example, 53 means 5 x 5 x 5. The exponent is 3.
Exponential decay
A pattern of decrease in which each value is found by multiplying the previous value by a constant factor greater than 0 and less than 1. For example, the pattern 27, 9, 3, 1, 1/3, 1/9,...shows exponential decay in which each value is 1/3 times the previous value.
Exponential form
A quantity expressed as a number raised to a power. In exponential form, 32 can be written as 25. The exponential form of the prime factorization of 5,000 is 23 x 54.
Exponential functions
Relationships between two variables that are exponential. For example, the function represented by y = 4n-1 for placing 1 ruba on square one, 4 rubas on square two, 16 rubas on square three, and so on, is an exponential function.
Exponential growth
A pattern of increase in which each value is found by multiplying the previous value by a constant factor greater than 1. For example, the doubling pattern 1, 2, 4, 8, 16, 32,...shows exponential growth in which each value is 2 times the previous value.
Exponential relationship
A relationship that shows exponential growth or decay.
Expression
A mathematical phrase containing numbers, variables, and operation symbols.
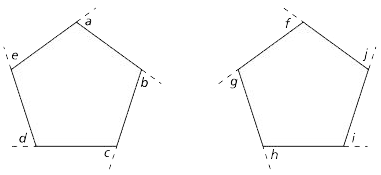
Exterior angle
An angle at a vertex of a polygon where the sides of the angle are one side of the polygon and the extension of the other side meeting at the vertex. In the pentagons below, angles a, b, c, d, e, f, g, h, i, and j are exterior angles.
top
F
Face
A flat two-dimensional surface of a three-dimensional shape.

Fact family
A set of related addition-subtraction sentences or multiplication-division sentences. For example, the set of numbers, 3, 5, and 15 is part of this multiplication-division fact family:
3 x 5 = 15 5 x 3 = 15
15 ÷ 5 = 3 15 ÷ 3 = 5
If you have one fact from a family, you can use the addition-subtraction or multiplication-division relationship to write the three related facts that are also part of the family. For example, with 2 + 3 = 5, you can use the relationship between addition and subtraction to write the related number sentences 3 + 2 = 5, 5 – 3 = 2, and 5 – 2 = 3.
Factor
One of two or more whole numbers that are multiplied to get a product. For example, 13 and 4 are both factors of 52 because 13 x 4 = 52
Factor pair
Two whole numbers that are multiplied to get a product. For example, the pair of numbers 13 and 4 is a factor pair of 52 because 13 x 4 = 52.
Factored form
The form of an expression made up of products of factors rather than sums or differences of terms. The expressions 2 x 2 x 5, 3(2 + 7), (x + 3)(x + 4), and x(x + 2) are in factored form.
Factorization
A product of numbers, perhaps with some repetitions, resulting in the desired number. A number can have many factorizations. For ex ample, two factorizations of 60 are 3 x 20 and 2 x 2 x 15.
Fair game
A game in which each player is equally likely to win. The probability of winning a two- person fair game is 1/2 . An unfair game can be made fair by adjusting the scoring system, or the payoffs. For example, suppose you play a game in which two fair coins are tossed. You score when both coins land heads up. Otherwise, your opponent scores. The probability that you will score is 1/4 , and the probability that your opponent will score is 3/4 . To make the game fair, you might adjust the scoring system so that you receive 3 points each time you score and your opponent receives 1 point when he or she scores. This would make the expected values for each player equal, which results in a fair game.
Favorable outcome
n outcome that gives a desired result. A favorable outcome is sometimes called a success . For example, when you toss two coins to find the probability of the coins matching, HH and TT are favorable outcomes.
Feasible points
The set of all solutions that satisfies an equation, an inequality, or a system.
Find (Academic Vocabulary)
To use the given information and any related facts to determine or calculate a value. You may use mathematical al gorithms, properties, formulas, or a combination of these, as well as other mathematical strategies, when finding a value.
Related terms:
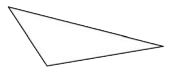
calculate, discover, determine
Sample: Find the area of the triangle below.
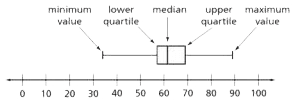
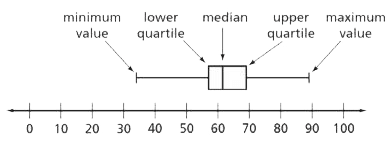
Five-number summary
The minimum value, lower quartile, median, upper quartile, and maximum value for a data set. These five values give a summary of the shape of the distribution and are used to make box plots. The five-number summary is noted on the box plot below.
Formula
A rule containing variables that represents a mathematical relationship. An example is the formula for finding the area of a rectangle: A = lw, where l represents the length and w represents the width.
Fraction
A mathematical expression in the form a/b where a and b are numbers. A fraction can indicate a part of a whole object or set, a ratio of two quantities, or a division. For the picture below, the fraction 3/4 shows the part of the rectangle that is shaded. The denominator 4 indicates the number of equal-size pieces. The numerator 3 indicates the number of pieces that are shaded.
The fraction 3/4 could also represent three of a group of four items meeting a particular criteria. For example, when 12 students enjoyed a particular activity and 16 students did not (the ratio is 3 to 4). Or, the amount of pizza each person receives when three pizzas are shared equally among four people (3 ÷ 4 or 3/4 of a pizza per person).
Frequency
The number of times a given data value occurs in a data set.
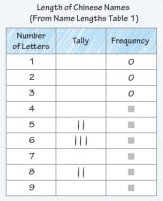
Frequency table
A table that lists all data values, and uses tally marks or some other device to show the number of times each data value occurs.
Function
A relationship between two variables in which the value of one variable depends on the value of the other variable. For example, the distance d in miles covered in t hours by a car traveling at 55 mph is given by the equation d = 55t . The relationship between the distance and the time is a function, and we say that the distance is a function of the time.
Function notation
An expression in the form f(x) that represents the value of the dependent variable when the independent variable is x. The notation is read ‘f of x’.
Function rule
An equation that describes a function.
Fundamental Theorem of Arithmetic
The theorem stating that, except for the order of the factors, every whole number greater than 1 can be factored into prime factors in only one way. For example, 60 = 2 x 2 x 3 x 5.
topG
Gap
A value or several consecutive values, between the minimum and maximum observed data values, where no data value occurred. For example, consider the data set 2, 2, 2, 2, 3, 3, 7, 7, 8, 9, 10, 11. There is a cluster of data values at 2 (or from 2 to 3) and a gap between data values 3 and 7.
Geometric
A number sequence in which each term is multiplied by the same factor to find the next term.
For example, 9, 3, 1, 1/3,...
Greatest Common Factor (GCF)
The greatest factor that two or more numbers share. For example, 1, 2, 3, and 6 are common factors of 12 and 30, but 6 is the greatest common factor.
Growth factor
The constant factor that each value in an exponential growth pattern is multiplied by to get the next value. The growth factor is the base in an exponential growth equation, and is a number greater than 1. For example, in the equation A = 25(3)d, where A is the area of a patch of mold and d is the number of days, the growth factor is 3. It indicates that the area of the mold for any day is 3 times the area for the previous day. In a table of (x, y) values for an exponential growth relationship (with x-values increasing by 1), the growth factor is the ratio of any y-value to the previous y-value.
Growth rate
The percent increase in an exponential growth pattern. For example, in Problem 3.1, the number of rabbits increased from 100 to 180 from year 0 to year 1, an 80% increase. From year 1 to year 2, the number of rabbits increased from 180 to 324, an 80% increase. The growth rate for this rabbit population is 80%. Interest, expressed as a percent, is a growth rate. For an exponential growth pattern with a growth factor of b, the growth rate is b – 1.
Guess and check
A method of solving an equation that begins with a guess. The first guess is checked against the equation and corrected until an exact solution is reached.
topH
Height of a three-dimensional figure
See measurements of three-dimensional figures.
Height of a two-dimensional figure
See measurements of two-dimensional figures.
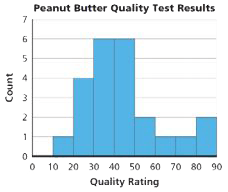
Histogram
A display that shows the distribution of numeric data. The range of data values, divided into intervals, is displayed on the horizontal axis. The vertical axis shows frequency in numbers or in percents. The height of the bar over each interval indicates the count or percent of data values in that interval. The histogram below shows quality ratings for certain brands of peanut butter. The height of the bar over the interval from 20 to 30 is 4. This indicates that four brands of peanut butter have quality ratings greater than or equal to 20 and less than 30.
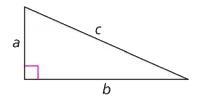
Hypotenuse
The side of a right triangle that is opposite the right angle. The hypotenuse is the longest side of a right triangle. In the triangle below, the side labeled c is the hypotenuse.
top
I
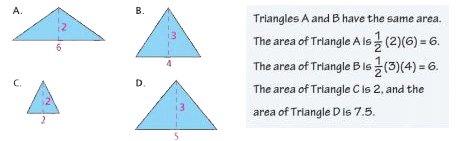
Identify (Academic Vocabulary)
To match a definition or a description to an object or to recognize something and be able to name it.
Related terms:
name, find, recognize, locate
Sample: Identify the triangles shown below that have the same area. Explain.
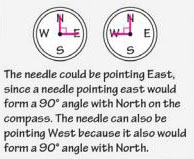
Illustrate (Academic Vocabulary)
To show or present information usually as a drawing or a diagram. You can also illustrate a point using a written explanation.
Related terms:
present, display
Sample: The needle of a compass is pointing 90 degrees from North. In which direction can the needle be pointing? Make a sketch to illustrate this situation.
Image
The figure that results from some transformation of a figure. It is often of interest to consider what is the same and what is different about a figure and its image.
Imaginary number
Any number of the form bi, where b is a real number, and b ≠ 0.
Imaginary unit
The complex number i whose square is -1.
Improper fraction
A fraction in which the absolute value of the numerator is greater than the absolute value of the denominator. The fraction 5/2 is an improper fraction. The fraction 5/2 means 5 halves and is equivalent to 2 1/2.

Income
The amount of money taken in.
Independent variable
One of the two variables in a relationship. Its value determines the value of the other variable, called the dependent variable. If you organize a bike tour, for example, the number of people who register to go (independent variable) determines the cost for renting bikes (dependent variable).
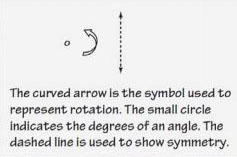
Indicate (Academic Vocabulary)
To point out or show.
Related terms:
Related terms: demonstrate, show, identify
Sample: Indicate which symbol is used to represent rotation.
Inequality
A statement that two quantities are not equal. The symbols >, <, ≤, and ≥ are used
to express inequalities. For example, if a and b are two quantities, then “a is greater
than b” is
written as a > b, and “a is less than b” is written as a < b. The statement a ≥, b
means “a is
greater than or equal to b.” The statement a ≤ b means that “a is less than or equal
to b.”
Integers
The whole numbers and their opposites. 0 is an integer, but is neither positive nor negative. The integers from -4 to 4 are shown on the number line below

Interior angle
The angle inside a polygon formed by two adjacent sides of the polygon. In the pentagon below, a, b, c, d, and e are interior angles.
Interquartile range (IQR)
The difference of the values of the upper quartile (Q3) and the lower quartile (Q1). In the box-and-whisker plot below, the upper quartile is 69, and the lower quartile is 58. The IQR is the difference 69 – 58 = 11.
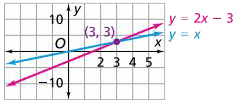
Intersecting lines
Lines that cross or intersect. The coordinates of the point where the lines intersect are solutions to the equations for both lines. The graphs of the equations y = x and y = 2x – 3 intersect at the point (3, 3). This number pair is a solution to each equation.
Interval
A continuous group of numbers. For example, a survey might collect data about people’s ages. The responses could be grouped into intervals, such as 5–9, 9–12, and 12–16. The interval 5–9 would include all ages 5 and older but not quite 9. If your ninth birthday were tomorrow, your data would fall into the interval 5–9.
Inverse function
If a function f(x) pairs each input value a with a unique output value b, then the inverse of f(x) is the function that pairs each b with a. The inverse of f(x) is written as f-1(x).
If f(x) = 3x + 2, then f-1(x) = x-2/3 because, for example, f(4) = 14 and f-1(14) = 4, and so on.
Inverse variation
A nonlinear relationship in which the product of two variables is constant. An inverse variation can be represented by an equation of the form y = k /x, or xy = k, where k is a constant. In an inverse variation, the values of one variable decrease as the values of the other variable increase.
Irrational number
A number that cannot be written as a quotient of two integers where the denominator is not 0. The decimal representation of an irrational number never ends and never shows a repeating pattern of a fixed number of digits. The numbers √2, √3 , √5 , π are examples of irrational numbers.
Irregular polygon
A polygon that has at least two sides with different lengths or two angles with different measures.
Isosceles triangle
A triangle with two sides the same length.
topJ
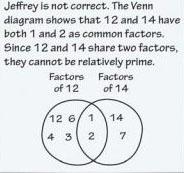
Justify (Academic Vocabulary)
To support your answers with reasons or examples. A justification may include a written response, diagrams, charts, tables, or a combination of these.
Related terms:
validate, explain, defend, reason
Sample: Jeffrey claims that 12 and 14 are relatively prime numbers. Is Jeffrey correct? Justify your answer.
 top
topL
Lateral face
A face of a three-dimensional shape that is not a base. For a prism, the lateral faces are parallelograms. The lateral faces of a right prism are rectangles. For a pyramid, the lateral faces are triangles that meet at the vertex.
Law of large numbers
This law states, in effect, that as more trials of an experiment are conducted, the experimental probability more closely approximates the theoretical probability. It is not at all unusual to have 100% heads after three tosses of a fair coin, but it would be extremely unusual to have even 60% heads after 1,000 tosses. This is expressed by the Law of Large Numbers.
Least common multiple (LCM)
The least multiple that two or more numbers share. Common multiples of 6 and 8 include 24, 48, and 72, but 24 is the least common multiple.
Legs
The sides of a right triangle that are adjacent to the right angle.
Length of a three-dimensional figure
See measurements of three-dimensional figures.
Length of a two-dimensional figure
See measurements of two-dimensional figures.
Like terms
Terms with the same variable raised to the same power. In the expression 4x2 + 3x – 2x2 – 2x + 1, 3x and -2x are like terms, and 4x2 and -2x2 are like terms.
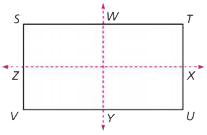
line of symmetry
A line of symmetry divides a figure into halves that are mirror images. Lines WY and ZX below are lines of symmetry.
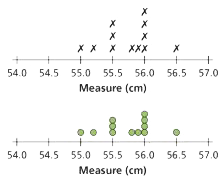
Line plot
A way to organize data along a number line where the X (or other symbols) above a number represent how often each value is mentioned. A line plot made with dots is sometimes referred to as a dot plot.
Line reflection
A transformation that maps each point of a figure to its mirror image, where a line acts as the mirror. Polygon A′B′C′D′E′ below is the image of polygon ABCDE under a reflection in the line. If you drew a line segment from a point to its image, the segment would be perpendicular to, and bisected by, the line of reflection.
Linear equation in slope-intercept form
The slope-intercept form of a linear equation is y = mx + b, where m is the slope and b is the y-intercept.
Linear equation in standard form
The standard form of a linear equation is Ax + By = C, where A, B, and C are integers and A and B are not both zero. The equation 6x + 3y = 12 is in standard form. Although the slope-intercept form, y = mx + b, is common and useful, it is not considered the “standard form.”
Linear function
A function whose graph is a line.
Linear inequality
A mathematical sentence, such as Ax + By + C < Dx + Ey + F, which expresses a relationship of inequality between two quantities, each of which is a linear expression. For example, y < -2x + 4 and 6x + 3y ≥ 12 are linear inequalities, as are x < 3 and 2x + 3 < 7x.
Linear relationship
A relationship in which there is a constant rate of change between two
variables. A linear relationship can be represented by a straight-line graph and by
an equation
of the form y = mx + b. In the equation, m is the slope of the line, and b is the y-intercept.
Linear term
A part of an algebraic expression in expanded form in which the variable is raised
to
the first power. In the expression 4x2 + 3x – 2x + 1, 3x and -2x are linear terms.
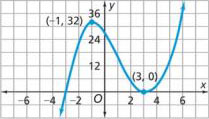
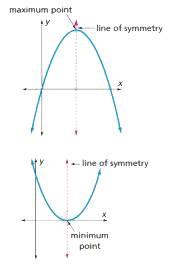
Local maximum
The value f(k) of a function f(x) that is greater than all other values of that function in some neighborhood of x = k. Local maximum points are represented by hilltops on graphs of f(x). In the graph shown below, (-1, 32) is a local maximum.
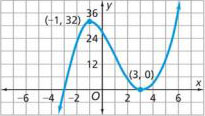
Local minimum
The value f(x) of a function f(x) that is less than all other values of that function in some neighborhood of x = k. Local minimum points are represented by valley bottoms on graphs of f(x). In the graph shown above, (3, 0) is a local minimum.
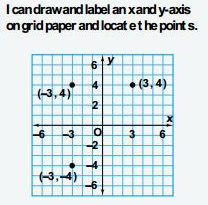
Locate (Academic Vocabulary)
To find or identify a value, usually on a number line or coordinate graph.
Related terms:
find, identify
Sample: Locate and label the points (-3, 4), (-3, -4) and (3, 4) on the coordinate graph.
Lower quartile
The median of the data to the left of the median (assuming the data are listed from least value to greatest value). For example, consider a data set with an odd number of items:
1, 2, 5, 6, 7, 8, 8, 10, 12, 15, 20
There are 11 items. The median of the data set is 8. (Six values are at or below 8 and six are at or above 8.) The median of the data to the left of the median (1, 2, 5, 6, 7) is 5. The lower quartile is 5. Now consider a data set with an even number of items:
2, 3, 4, 5, 6, 6, 8, 8
There are eight items. The median of the data set is 5.5, the average of 5 and 6. The data items to the left of the median are 2, 3, 4, and 5. The median of these values is 3.5. The lower quartile is 3.5.
topM
Markup
The amount added to the buying price of an item. It is usually a percent of the buying price.
Mathematical model
An equation or a graph that describes, at least approximately, the relationship between two variables. To make a mathematical model, acquire data, plot the data points, and, when the points show a pattern, find the equation of a line or curve that fits the trend in the data. A mathematical model allows you to make reasonable guesses for values between and beyond the data points.
Maximum value (data)
The data item with the greatest value in a data set. In the data set 2, 2, 2, 2, 3, 3, 7, 7, 8, 9, 10, 11, the maximum value is 11.
Maximum value (function)
The greatest y-value of a function. If y is the height of a thrown object, then the maximum value of the height is the highest point the object reaches. If you throw a ball into the air, its height increases until it reaches the maximum height, and then its height decreases as it falls back to the ground. If y is the area of a rectangle with a fixed perimeter, then the maximum value of the area, or simply the maximum area, is the greatest area possible for a rectangle with that perimeter. In this Unit, you found that the maximum area for a rectangle with a perimeter of 20 meters is 25 square meters.
Mean
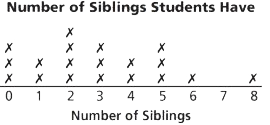
The value found when all the data are combined and then redistributed evenly. For example, the total number of siblings for the data in the line plot below is 56. If all 19 students had the same number of siblings, they would each have about 3 siblings. Differences from the mean “balance out” so that the sum of differences below and above the mean equal 0. The mean of a set of data is the sum of the values divided by the number of values in the set.
Mean absolute deviation (MAD)
The average distance of all of the data values in a data set from the mean of the distribution.
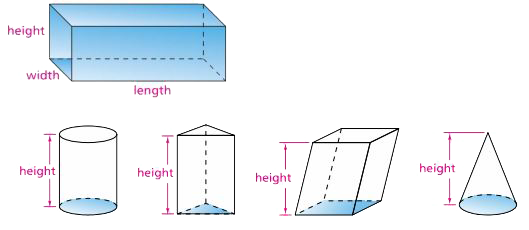
Measurements of three-dimensional figures
s Dimensions, such as length, width, and height, which describe the size of three-dimensional figures. If the base of the figure is a rectangle, length and width refer to the length and width of the figure’s rectangular base. The height of a three-dimensional figure is the vertical distance from the bottom of the figure to its top.
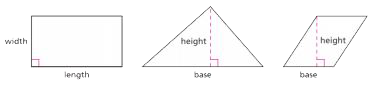
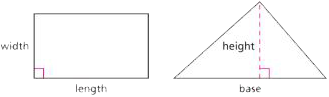
Measurements of two-dimensional figures
Dimensions, such as length, width, base, and height, which describe the size of two-dimensional figures. The longest dimension or the dimension along the bottom of a rectangle is usually called the length, and the other dimension is called the width, but it is not incorrect to reverse these labels. The word base is used when talking about triangles and parallelograms. The base is usually measured along a horizontal side, but it is sometimes convenient to think of one of the other sides as the base. For a triangle, the height is the perpendicular distance from a vertex opposite the base to the line containing the base. For a parallelogram, the height is the perpendicular distance from a point on the side opposite the base to the base. You need to be flexible when you encounter these terms, so you are able to determine their meanings from the context of the situation.
Median
The number that marks the midpoint of an ordered set of data. At least half of the values lie at or above the median, and at least half lie at or below the median. For the sibling data above (0, 0, 0, 1, 1, 2, 2, 2, 2, 3, 3, 3, 4, 4, 5, 5, 5, 6, 8), the median of the distribution of siblings is 3 because the tenth (middle) value in the ordered set of 19 values is 3. When a distribution contains an even number of data values, the median is computed by finding the average of the two middle data values in an ordered list of the data values. For example, the median of 1, 3, 7, 8, 25, and 30 is 7.5 because the data values 7 and 8 are third and fourth in the list of six data values.
Midpoint
A point that divides a line segment into two segments of equal length. In the figure below M is the midpoint of the segment LN.
Minimum value (data)
The data item with the least value in a data set. In the data set 2, 2, 2, 2, 3, 3, 7, 7, 8, 9, 10, 11, the minimum value is 2.
Minimum value (function)
The least y-value of a function. If y is the cost of an item, then the minimum value of the cost, or simply the minimum cost, is the least cost possible for the item.
Mixed number
A number that is written with both a whole number and a fraction. A mixed number is the sum of the whole number and the fraction. The number 2 1/2 represents 2 wholes and a 1/2 and can be thought of as 2 + 1/2.
Mode
The value that appears most frequently in a set of data. In the data set 2, 2, 2, 2, 3, 3, 7, 7, 8, 9, 10, 11, the mode is 2.
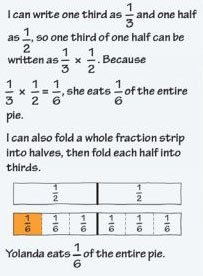
Model (Academic Vocabulary)
To represent a situation using pictures, diagrams, number sentences, or experiments.
Related terms:
represent, demonstrate
Sample: Yolanda has one half of an apple pie. She eats one third of the half of a pie. Model this situation using a number sentence or a picture.
Multiple
The product of a given whole number and another whole number. For example, some multiples of 3 are 3, 6, 9, and 12. Note that if a number is a multiple of 3, then 3 is a factor of the number. For example, 12 is a multiple of 3, and 3 is a factor of 12.
Multiplicative identity
The multiplicative identity for rational numbers is 1 or any rational expression equal to 1. Multiplying any rational number by 1 results in a product identical to the original rational number. For any rational number N, N x 1 = N , or for any nonzero rational numbers R and a/b, a/b x R/R = a/b. For example, 4/9 x 1 = 4/9, and 5/8 x 3/3 = 5/8.
Multiplicative inverses
Two numbers, a and b, that satisfy the equation ab = 1. For example, 3 and 1/3 are multiplicative inverses, and -1/2 and -2 are multiplicative inverses.
topN
Near-perfect number
A number for which the sum of all its proper factors is one less than the number. All powers of 2 are near-perfect numbers. For example, 32 is a near-perfect number because its proper factors, 1, 2, 4, 8, and 16, add to 31.
Negative number
A number less than 0. On a number line, negative numbers are located to the left of 0 (on a vertical number line, negative numbers are located below 0).
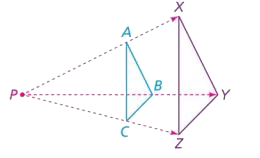
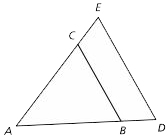
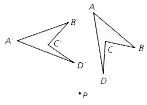
Nested triangles
Triangles that share a common angle are sometimes called nested. In the figure below, triangle ABC is nested in triangle ADE.
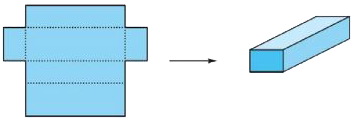
Net
A two-dimensional pattern that can be folded into a three-dimensional figure.
Nth root
The nth root of a number b is a number r which, when raised to the power of n, is equal to b. That is, rn = b and b1/n = r.
Number sentence
A mathematical statement that gives the relationship between two expressions that are composed of numbers and operation signs. For example, 3 + 2 = 5 and 6 x 2 > 10 are number sentences; 3 + 2, 5, 6 x 2 and 10 are expressions.
Numerator
The number written above the line in a fraction. In the fraction 5/8, 5 is the numerator. When you interpret the fraction 5/8 as a part of a whole, the numerator 5 tells that the fraction refers to 5 of the 8 equal parts.
Numerical data
Values that are numbers such as counts, measurements, and ratings. Here are some examples.
- Number of children in families
- Pulse rates (number of heart beats per minute)
- Heights
- Amounts of time people spend reading in one day
- Ratings such as: on a scale of 1 to 5 with 1 as “low interest,” how would you rate your interest in participating in the school’s field day?
O
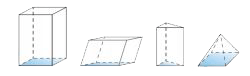
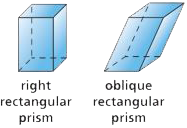
Oblique prism
A prism for which some or all of the side faces (or lateral faces) are nonrectangular parallelograms.

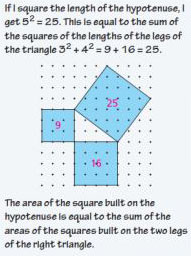
Observe Academic Vocabulary
To notice or to examine carefully one or more characteristics of a particular object.
Related terms:
notice, examine, note, see
Sample: What do you observe about the sum of the squares of the lengths of the legs of the right triangle in relationship to the length of the hypotenuse?

Obtuse triangle
An obtuse triangle has one angle with a measure greater than 90°.
Odd number
A whole number that is not a multiple of 2. When an odd number is divided by 2, the remainder is 1. Examples of odd numbers are 1, 3, 5, 7, and 9.
Opposites (Academic Vocabulary)
Two numbers whose sum is 0. For example, -3 and 3 are opposites. On a number line, opposites are the same distance from 0 but in different directions from 0. The number 0 is its own opposite.
Order of operations
A set of agreements or conventions for carrying out calculations with one or more operations, parentheses, or exponents.
- Work within parentheses.
- Write numbers written with exponents in standard form.
- Do all multiplication and division in order from left to right.
- Do all addition and subtraction in order from left to right.
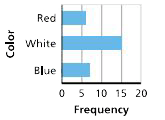
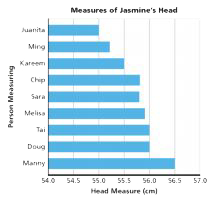
Ordered-value bar graph
A bar graph in which the bars are arranged by increasing (or decreasing) order of length.
Origin
The point where the x- and y-axes intersect on a coordinate graph. With coordinates (0, 0), the origin is the center of the coordinate plane.
Outcome
A possible result. For example, when a number cube is rolled, the possible outcomes are 1, 2, 3, 4, 5, and 6. Other possible outcomes are even or odd. Others are three and not three. When determining probabilities, it is important to be clear about what the possible outcomes are.
Outlier
A value that lies far from the “center” of a distribution and is not like other values. Outlier is a relative term, but it indicates a data point that is much higher or much lower than the values that could be normally expected for the distribution. To identify an outlier in a distribution represented by a boxplot, measure the distance between Q3 and any suspected outliers at the top of the range of data values; if this distance is more than 1.5 x IQR, then the data value is an outlier. Likewise, if the distance between any data value at the low end of the range of values and Q1 is more than 1.5 x IQR, then the data value is an outlier.
Overestimate
To make an estimate that is slightly greater than the actual value.
topP
Parabola
The graph of a quadratic function. A parabola has a line of symmetry that passes through the maximum point if the graph opens downward or through the minimum point if the graph opens upward.
Parallel lines
Lines in a plane that never meet. The opposite sides of a regular hexagon are parallel.
Polygons A and B each have one pair of opposite sides parallel. Polygons C, D, and E each have two pairs of opposite sides parallel.
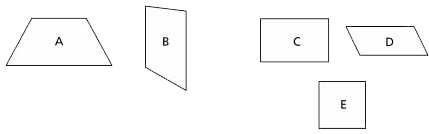
Parallelogram
A quadrilateral with opposite sides parallel. Both pairs of opposite angles are also equal. In the definition of parallel lines, figure D, rectangle C, and square E are all parallelograms.
Part-to-part ratio
A part-to-part ratio represents a relationship between one part of a whole and another part of the whole. For example, in a recipe that calls for 2 cans of juice concentrate and 3 cans of water, the ratios 2 : 3 and 3 : 2 are part-to-part ratios.
Part-to-whole ratio
A part-to-whole ratio represents a relationship between one part of a whole and the whole. For example, in a recipe that calls for 2 cans of juice concentrate and 3 cans of water, the ratios 2 : 5 and 3 : 5 are part-to-whole ratios, because there are 5 cans in all.
Pattern
A change that occurs in a predictable way. For example, the squares on a checkerboard form a pattern in which the colors of the squares alternate between red and black. The sequence of square numbers: 1, 4, 9, 16, . . . forms a pattern in which the numbers increase by the next odd number. That is, 4 is 3 more than 1, 9 is 5 more than 4, 16 is 7 more than 9, and so on.
Payoff
The number of points (or dollars or other objects of value) a player in a game receives for a particular outcome.
Percent
“Out of 100.” A percent is a special decimal fraction in which the denominator is 100. When we write 68% we mean 68 out of 100, 68/100 , or 0.68. We write the percent sign (%) after a number to indicate percent. The shaded part of this square is 68%.

Perfect number
A number for which the sum of all its proper factors is the number itself. For example, 6 is a perfect number because its proper factors, 1, 2, and 3, add to 6.
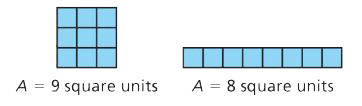
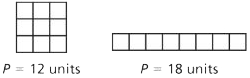
Perimeter
The measure of the distance around a two-dimensional figure. Perimeter is a measure of length. To find the perimeter P of a figure, you count the number of unit lengths it takes to surround the figure. When you find the perimeter of a shape, write the units (such as centimeters, feet, or yards) to indicate the unit that was used to find the perimeter. The perimeter of the square below is 12 units, because 12 units of length surround the figure. The perimeter of the rectangle is 18 units. Notice that the rectangle has a greater perimeter, but a lesser area, than the square.
Perpendicular lines
Lines that meet at right angles. The length and width of a rectangle are perpendicular to each other and the base and height of a triangle are perpendicular to each other. In diagrams, perpendicular lines are often indicated by drawing a small square where the lines meet. For example, the sides of a right triangle that form the right angle are perpendicular.
Pi (π)
The mathematical name for the ratio of a circle’s circumference to its diameter. This ratio is the same for every circle, and is approximately equal to 3.1416.
Piecewise-defined function
A function that has different rules for different parts of its domain.
Point of intersection
The point where two lines intersect. If the lines are represented on a coordinate grid, the coordinates for the point of intersection can be read from the graph.
Polygon
A shape formed by three or more line segments, called sides. Each segment meets exactly two other segments, and all of the points where the segments meet are endpoints of the segments.

Special polygon names use Greek prefixes that tell the number of sides or the number of angles in a polygon.
- triangle: A polygon with 3 sides and angles
- quadrilateral: A polygon with 4 sides and angles
- pentagon: A polygon with 5 sides and angles
- hexagon: A polygon with 6 sides and angles
- heptagon: A polygon with 7 sides and angles
- octagon: A polygon with 8 sides and angles
- nonagon (also called enneagon): A polygon with 9 sides and angles
- decagon: A polygon with 10 sides and angles
- dodecagon: A polygon with 12 sides and angles
Polynomial
An algebraic expression in the form anxn + an-1xn-1 + . . . + a1x1 + a0, where n is a whole number and the coefficients an, an-1, a1, and a0 are numbers. example 2x2 , 3x + 7, 28, and -7x3 – 2x2 + 9 are all polynomials.
Polynomial function
A function with a rule represented in the form
f(x) = anxn + an-1xn-1 + . . . + a1x1 + a0
For example, f(x) = x3 + x2 - 6x + 2
Population
The entire collection of people or objects you are studying.
Positive number
A number greater than 0. (The number 0 is neither positive nor negative.) On a number line, positive numbers are located to the right of 0. On a vertical number line, positive numbers are located above 0.
Predict (Academic Vocabulary)
To make an educated guess based on the analysis of real data.
Related terms:
terms: estimate, survey, analyze, observe
Sample: Dan knows that the mean life span of his type of tropical fish is 2 years. What other information could help Dan predict how long his fish will live?

Prime factorization
A product of prime numbers, perhaps with some repetitions, resulting in the desired number. For example, the prime factorization of 7,007 is 7 x 7 x 11 x 13. The prime factorization of a number is unique except for the order of the factors.
Prime number
A number with exactly two factors, 1 and the number itself. Examples of primes are 11, 17, 53, and 101. The number 1 is not a prime number because it has only one factor.
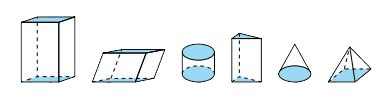
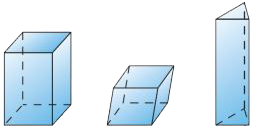
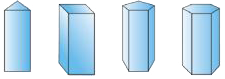
Prism
A three-dimensional shape with a top and bottom (base) that are congruent polygons and lateral faces that are parallelograms.
Probability
A number between 0 and 1 that describes the likelihood that an outcome will occur. For example, when a fair number cube is rolled, a 2 can be expected 1/6 of the time, so the probability of rolling a 2 is 1/6. The probability of a certain outcome is 1, while the probability of an impossible outcome is 0.
Profit
The amount by which income is greater than expenses.
Proper factors
All the factors of a number, except the number itself. For example, the proper factors of 16 are 1, 2, 4, and 8.
Properties of equality
The properties of equality state that if you add or subtract the same quantity from each side of an equation, the two sides of the equation remain equal. If you multiply or divide each side of an equation by the same nonzero quantity, the two sides of the equation remain equal.
Additionally, for all real numbers a, b, and c:
- Addition: If a = b, then a + c = b + c.
- Subtraction: If a = b, then a - c = b - c.
- Multiplication: If a = b, then a x c = b x c
- Division: If a = b and c ≠ 0, then a/c = b/c.
Proportion
An equation stating that two ratios are equal. For example
Note that this does not necessarily imply that “hours spent on homework” = 2 or that “hours spent in school” = 7. During a week, 10 hours may have been spent on homework while 35 hours were spent in school. The proportion is still true because 10/35 = 2/7.
Protractor
A protractor is a type of semi- circular ruler with scale measured in degrees. The degree measures on a protractor are listed both in ascending and descending order to measure angles regardless of their orientation.
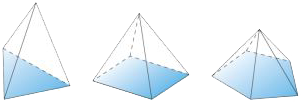
Pyramid
A three-dimensional shape with one polygonal base and lateral sides that are all triangles that meet at a vertex opposite the base.
Pythagorean Theorem
A statement about the relationship among the lengths of the sides of a right triangle. The theorem states that if a and b are the lengths of the legs of a right triangle and c is the length of the hypotenuse, then a2 + b2 = c2 .
topQ
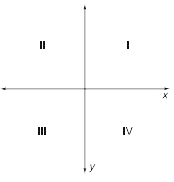
Quadrants
The four sections into which the coordinate plane is divided by the x- and y-axes. The quadrants are labeled as follows:
Quadratic expression
An expression that is equivalent to an expression of the form ax2 + bx + c, where a, b, and c are numbers and a ≠ 0. An expression in factored form is quadratic if it has exactly two linear factors, each with the variable raised to the first power. An expression in expanded form is quadratic if the highest power of the variable is 2. For example, 2x2 , 3x2 – 2x, and 4x2 + 2x – 7 are all quadratic expressions. The expression x(x – 2) is also a quadratic expression because x(x – 2) = x2 – 2x. In Frogs, Fleas and Painted Cubes, students use quadratic expressions to represent areas of rectangles for a fixed perimeter, the number of high fives between members of a team, and the path of a ball thrown into the air.
Quadratic formula
If ax2 + bx + c = 0 and a ≠ 0, then x = -b/2a ± √b2-4ac/2a
2x2 + 10x + 12 = 0
x = -b/2a ± √b2-4ac/2a
x = -10/2(2) ± √102 - 4(2)(12)/2(2)
x = -10/4 ± √4/4
x = -10/4 + 2/4 or x = -10/4 - 2/4
x = -2 or -3
Quadratic function
A function between independent and dependent variables such that, as the dependent values increase by a constant amount, the successive (first) differences between the dependent values change by a constant amount. For example, in y = x2 , when x increases by 1, the first differences for y are 3, 5, 7, 9, . . . and then the second differences are 2, 2, 2, . . . The graphs of quadratic functions have the shape of a U, or upside down ∩, with a line of symmetry through a maximum or minimum point on the graph that is perpendicular to the x-axis.
Quadratic term
A part of an expression in expanded form in which the variable is raised to the second power. In the expression 4x2 + 3x – 2x2 – 2x + 1, 4x2 and -2x2 are quadratic terms.
Quartile
One of three points that divide a data set into four equal groups. The second quartile, Q2, is the median of the data set. The first quartile, Q1, is the median of the lower half of the data set. The third quartile, Q3, is the median of the upper half of the data set.
Quotient
The name for the answer to a division problem. For example, 6.625 is the quotient in the number sentence 26.5 ÷r; 4 = 6.625.
topR
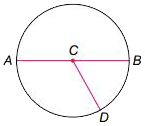
Radius
A segment from the center of a circle to a point on the circle. The length of this segment is also called the radius. The radius is half of the diameter. CD is one radius of the circle below. The plural of radius is radii. All the radii of a circle have the same length.
Random
Outcomes that are uncertain when viewed individually, but which exhibit a predictable pattern over many trials. For example, when you roll a fair number cube, you have no way of knowing what the next roll will be, but you do know that, over the long run, you will roll each number on the cube about the same number of times.
Random sampling
Choosing a sample in a way that gives every member of a population an equally likely chance of being selected.
Range
The difference of the maximum value and the minimum value in a distribution. If you know the range of the data is 12 grams of sugar per serving, you know that the difference between the minimum and maximum values is 12 grams. For example, in the distribution 2, 2, 2, 2, 3, 3, 7, 7, 8, 9, 10, 11, the range of the data set is 9, because 11 – 2 = 9.
Rate
A comparison of quantities measured in two different units is called a rate. A rate can be thought of as a direct comparison of two sets (20 cookies for 5 children) or as an average amount (4 cookies per child). A rate such as 5.5 miles per hour can be written as 5.5 miles/1 hour or 5.5 miles : 1 hour.
Rate of change
The amount of change in the dependent variable produced by a given change in the independent variable.
Rate table
A table that shows the value of a single item in terms of another item. It is used to show equivalent ratios of the two items. You can use a rate to find and organize equivalent rates in a rate table.
Movie Tickets
| Number of people | 1 | 2 | 3 | 4 | 5 |
|---|---|---|---|---|---|
| Total Price | $12 | $24 | $36 | $48 | $60 |
Cost of Limes
| Number of Limes | 1 | 2 | 3 | 4 | 5 | 10 | 15 | 20 |
|---|---|---|---|---|---|---|---|---|
| Cost of Limes | $0.20 | $0.40 | $0.60 | $0.80 | $1.00 | $2.00 | $3.00 | $4.00 |
Ratio
A comparison of two quantities expressed with a phrase such as ‘the ratio of 3 to 5’ which means ‘3 for every 5.’ Such ratio comparisons are often written as common fractions, equivalent decimals and percents, and in the special notation 3 : 5.
3/5 3 to 5 3 : 5
As another example, suppose the length AB is 2 inches and the length CD is 3 inches. The ratio of the length of side AB to the length of side CD is 2 to 3, or 2/3. The ratio of the length of side CD to the length of side AB is 3 to 2, or 3/2.
Rational number
Numbers that can be expressed as a quotient (fraction) of two integers where the divisor (denominator) is not zero, such as 3/4, 13/4, 3/1, or -3/4. Also, 0.7999 is a rational number, since 0.799 = 799/1000.
Real numbers
The set of all rational numbers and all irrational numbers. The number line represents the set of real numbers.
Reason (Academic Vocabulary)
To think through using facts and information.
Related terms:
think, examine, logic
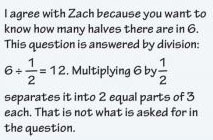
Sample: To find the number of 1/2 cup servings in 6 cups, Jenni says it is necessary to multiply 6 by 1/2. Zach says that 6 must be divided by 1/2 to find the number of servings. Do you agree with Jenni or Zach? Explain how you reasoned.
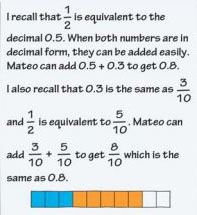
Recall (Academic Vocabulary)
To remember a fact quickly.
Related terms:
remember, recognize
Sample: Mateo wants to add 0.3 to 1/2. What fact can you recall about 1/2 or 0.3 that will help him find the sum? Explain.
Reciprocal
A factor by which you multiply a given number so that their product is 1. For example, 3 /5 is the reciprocal of 5/3, and 5/3 is the reciprocal of 3/5 because 3/5 x 5/3 = 1. Note that the reciprocal of 1 2/3 is 3/5 because 1 2/3 x 3/5 = 1
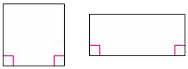
Rectangle
A parallelogram with all right angles. Squares are a special type of rectangle.
Rectangular prism
A prism with a top and bottom (base) that are congruent rectangles.
Reflection symmetry
A shape with reflection symmetry has two halves that are mirror images of each other.
Reflectional symmetry
A figure or design has reflectional symmetry if you can draw a line that divides the figure into halves that are mirror images. The line that divides the figure into halves is called the line of symmetry. The design below has reflectional symmetry about a vertical line through its center. Reflectional symmetry is sometimes referred to as mirror symmetry or line symmetry.

Regular Polygon
A polygon that has all of its sides equal and all of its angles equal. The hexagon below is regular, but the other hexagon is not regular, because its sides and its angles are not equal.

Regular prism
A prism whose bases are regular polygons.
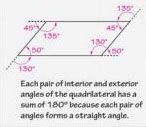
Relate (Academic Vocabulary)
To have or find a connection between two different things, or to find or have an impact on something else.
Related terms:
connect, match, correlate
Sample: Tell how the exterior angles of a quadrilateral relate to the interior angles.
Relationship
An association between two or more variables. If one of the variables changes, the other variable may also change, and the change may be predictable.
Relative frequency
The ratio of the number of desired results to the total number of trials. Written as a percent, relative frequencies help you compare samples of different sizes.
Relatively prime numbers
A pair of numbers with no common factors except for 1. For example, 20 and 33 are relatively prime because the factors of 20 are 1, 2, 4, 5, 10, and 20, while the factors of 33 are 1, 3, 11, and 33. Notice that neither 20 nor 33 is itself a prime number.
Repeating decimal
A decimal with a pattern of a fixed number of digits that repeats forever, such as 0.3333333. . . and 0.73737373. . . Repeating decimals are rational numbers.
Represent (Academic Vocabulary)
To stand for or take the place of something else. Symbols, equations, charts, and tables are often used to represent particular situations.
Related terms:
symbolize, stand for, correspond to
Sample: Which of the following sets of numbers represents the factors of 16? Explain.
- A. {1, 2, 3, 4, 9, 16}
- B. {2, 4, 8}
- C. {1, 2, 4, 8, 16}
- D. {16, 32, 48, 64}
Representative sample
A sample whose characteristics accurately reflect those of the larger population from which the sample was selected.
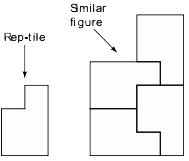
Rep-tile
A figure you can use to make a larger, similar version of the original is called a rep-tile. The smaller figure below is a rep-tile because you can use four copies of it to make a larger similar figure.
Residual
The error calculated by finding the difference between an actual data point and the value that a model for the data predicts.
Rhombus
A quadrilateral that has all sides the same length.
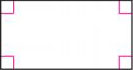
Right angle
An angle that measures 90°. A rectangle has four right angles.
Right prism
A prism whose vertical faces are rectangles. The bases are congruent polygons.
Right triangle
A right triangle is a triangle with one right angle.

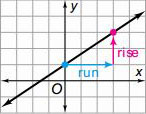
Rise
The vertical change between two points on a graph. The slope of a line is the rise divided by the run.
Roots
The roots of a two-variable equation are the values of x that make y equal 0. For example, the roots of y = x2 + 5x are -5 and 0 because (-5)2 + 5(-5) = 0 and 02 + 5(0) = 0. The roots of y = x2 + 5x are the solutions to the equation 0 = x2 + 5x. The roots of a two-variable equation are the x-intercepts of its graph.
Rotation
A transformation that turns a figure counterclockwise about a point. Polygon A′B′C′D′ below is the image of polygon ABCD under a 60° rotation about point P. If you drew a segment from a point on polygon ABCD to point P, the segments would be the same length and they would form a 60° angle
Rotation symmetry
A shape has rotation symmetry if it can be rotated less than a full turn about its center point to a position where it looks exactly as it did before it was rotated.
Rotational symmetry
A figure or design has rotational symmetry if it can be rotated less than a full turn about a point to a position in which it looks the same as the original. The design below has rotational symmetry with its center as the center of rotation and a 60o angle of rotation. This means that it can be rotated 60o , or any multiple of 60o , about its center point to produce an image that matches exactly with the original.

Rule
A summary of a predictable relationship that tells how to find the value of a variable. A rule may be given in words or as an equation. For example, this rule relates time, rate, and distance: distance is equal to rate times time, or d = rt.
Run
The horizontal change between two points on a graph. The slope of a line is the rise divided by the run.
topS
Sample
A group of people or objects selected from a population.
Sample space
The set of all possible outcomes in a probability situation. When you toss two coins, the sample space consists of four outcomes: HH, HT, TH, and TT.
Sampling distribution
The distribution of the means (or medians) from a set of same-size samples, each selected randomly from the same population.
Sampling plan
A detailed strategy for selecting a sample from a population, including what data will be collected, in what manner, and by whom.
Scale
A labeling scheme or the size of the units used on each of the axes on a graph or number line. For instance, each mark on the vertical axis might represent 10 units. When graphing, an appropriate scale must be selected so that the resulting graph will be clearly shown. For example, when graphing the equation y = 60x, a scale of 1 for the x-axis and a scale of 15 or 30 for the y-axis would be reasonable.
Scale drawing
An image of a figure that is similar to the original.
Scale factor
The number used to multiply the lengths of a figure to stretch or shrink it to a similar image. If we use a scale factor of 3, all lengths in the image are 3 times as long as the corresponding lengths in the original. When you are given two similar figures, the scale factor is the ratio of the image side length to the corresponding original side length.
Scalene triangle
A triangle with no sides equal.
Scatter plot
A graph used to explore the relationship between two variables. The graph below is a scatter plot of (height, arm span) for several people. Each point represents the height and arm span for each person.
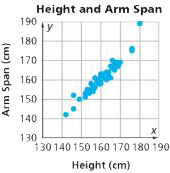
Scientific notation
A short way to write very large or very small numbers. A number is in scientific notation if it is of the form a x 10n , where n is an integer and 1 ≤ a < 10.
Sequence
An ordered list of numbers that often forms a pattern.
Shape of a distribution
The shape of a distribution can be described by identifying clusters and gaps, and by noting whether the distribution is symmetric or skewed.
Similar
Similar figures have corresponding angles of equal measure and the ratios of each pair of corresponding sides are equivalent.
Similar figures
Two figures are similar if one is an image of the other under a sequence of transformations that includes a dilation. If the scale factor is greater than 1, the side lengths of the image are greater than the corresponding side lengths of the original figure. If the scale factor is less than 1, the side lengths of the image are less than the corresponding side lengths of the original figure. If the scale factor is equal to 1, then the two figures are congruent.
Similarity transformation
A transformation that produces similar figures. The image of a figure under a similarity transformation, such as a dilation, has the same shape as the original figure, but may be a different size. A similarity transformation can also be a sequence of a rigid motion (reflection, rotation, or translation) and a dilation.
Simulate
To run an experiment modeling the relevant characteristics of a real-world situation for use in studying the behavior of the real-world situation.
Simulation
To run an experiment modeling the relevant characteristics of a real-world situation for use in studying the behavior of the real-world situation.
Sketch (Academic Vocabulary)
To draw a rough outline of something. When a sketch is asked for, it means that a drawing needs to be included in your response.
Related terms:
draw, illustrate
Sample: Sketch a 30° angle.
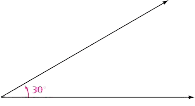
Skewed distribution
Any distribution that is not symmetrical about the mean.
Slope
The number that expresses the steepness of a line. The slope is the ratio of the vertical change to the horizontal change between any two points on the line. Sometimes this ratio is referred to as the rise over the run. The slope of a horizontal line is 0. Slopes are positive if the y-values increase from left to right on a coordinate grid and negative if the y-values decrease from left to right. The slope of a vertical line is undefined. The slope of a line is the same as the constant rate of change between the two variables. For example, the points (0, 0) and (3, 6) lie on the graph of y = 2x. Between these points, the vertical change is 6 and the horizontal change is 3, so the slope is 6/3 = 2, which is the coefficient of x in the equation.
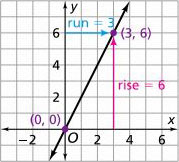
Solution of an equation
The value or values of the variables that make an equation true.
Solution of the system
A set of values for the variables that makes all the equations or inequalities true.
Solve (Academic Vocabulary)
To determine the value or values that make a given statement true. Several methods and strategies can be used to solve a problem including estimating, isolating the variable, drawing a graph, or using a table of values.
Related terms:
calculate, solution
Sample: Solve the equation 4(x – 3) = 2x.
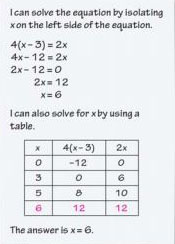
Solving an equation
Finding the value or values of the variables that make an equation true.
Solving quadratic equations
The process of finding the values of the variable that make the quadratic equation true. Methods for solving quadratic equations include factoring, completing the square, using the Quadratic Formula, and graphing.
Sphere
A three-dimensional shape whose surface consists of all the points that are a given distance from the center of the shape.

Square number
A number that is a result of the product of a number multiplied by itself. For example, 9 and 64 are square numbers because 9 = 3 x 3 and 64 = 8 x 8. A square number represents a number of square tiles that can be arranged to form a square.

Square root
If A = s2 , then s is the square root of A. For example, -3 and 3 are square roots of 9 because 3 x 3 = 9 and -3 x (-3) = 9. The √ symbol is used to denote the positive square root. So, you write √9 = 3. The positive square root of a number is the side length of a square that has that number as its area.
Standard deviation
Standard deviation measures the spread of a data set. The greater the standard deviation, the greater the spread of the data. To calculate the standard deviation, find the differences between the actual values and the mean. These differences are squared and averaged by dividing by (n – 1). This average is the variance. Take the square root of the variance to get the standard deviation.
Standard form
The most common way we express quantities. For example, 27 is the standard form of 33.
Step function
A function that pairs every number in an interval with a single value. The graph of a step function can look like the steps of a staircase.
Summarize (Academic Vocabulary)
To go over or review the most important points.
Related terms:
explain, demonstrate, present
Sample: Summarize what you know about isosceles, right, and equilateral triangles.
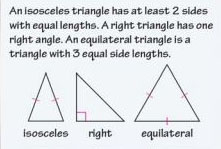
Summary statistic
A single number that conveys basic, but important, information about a distribution. Examples of summary statistics include the mean, median, mode, range, MAD, and IQR.
Supplementary angles
Supplementary angles are two angles that form a straight line. The sum of the angles is 180°.
Surface area
The area required to cover a three-dimensional shape.
Symmetric distribution
A distribution in which the mean and median are the same or almost the same, and in which the values above and below the mean form an approximate mirror image.
Symmetry
An object or design has symmetry if part of it, the basic design element, can be transformed repeatedly to produce the entire design. The butterfly below has reflectional symmetry, the pinwheel has rotational symmetry, and the wallpaper design has translational symmetry.

System of linear equations
Two or more linear equations that represent constraints on the variables used. A solution of a system of equations is a pair of values that satisfies all the equations in the system. For example, the ordered pair (1, 2) is the solution of the system because it satisfies both equations
System of linear inequalities
Two or more linear inequalities that represent constraints on the variables used. A solution of a system of inequalities is a pair of values that satisfies all the inequalities in the system. The solution of the system
is indicated by region A in the graph below. All the points in this region satisfy both inequalities. The points in region B satisfy -2x + y > 0, but not 6x + 3y < 12. The points in region C satisfy 6x + 3y < 12, but not -2x + y > 0. The points in the unshaded region do not satisfy either inequality
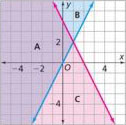
Systematic sampling
Choosing a sample in a methodical way. For example, if you survey every tenth person on an alphabetical list of names, you are surveying a systematic sample.
topT
Table
A tool for organizing information in rows and columns, or a list of values for two or more variables that shows the relationship between them. Tables often represent data made from observations, from experiments, or from a series of arithmetic operations. A table may show a pattern of change between two variables that can be used to predict values not in the table. Tables let you list categories or values and then tally the occurrences.
Favorite Colors
| Color | Number of Students |
|---|---|
| Red | 6 |
| White | 15 |
| Blue | 9 |
Tape diagram
A drawing that looks like a piece of tape, used to model expressions. Also called a bar model.
Term
A number, a variable, or the product of a number and a variable. In the expression 3x2 – 2x + 10, there are three terms: 3x2 , -2x, and 10.
Terminating decimal
A decimal that ends, or terminates, such as 0.5 or 0.125. Terminating decimals are rational numbers.
Tessellation
See tiling.
Theorem
A theorem is a general mathematical statement that has been proven true.
Theoretical probability
A probability obtained by analyzing a situation. If all the outcomes are equally likely, you can find a theoretical probability of an event by listing all the possible outcomes and then finding the ratio of the number of outcomes producing the desired event to the total number of outcomes. For example, there are 36 possible equally likely outcomes (number pairs) when two fair number cubes are rolled. Of these, six have a sum of 7, so the probability of rolling a sum of 7 is 6/36, or 1/6. Since the sum of the probabilities of all possible events must be 1, theoretical probability can be applied to events that are not equally likely. The probability of rolling a sum of 7 is 1/6, and the probability of not rolling a 7 is 5/6.
Tiling
Also called a tessellation. The covering of a plane surface with geometric shapes without gaps or overlaps. These shapes are usually regular polygons or other common polygons. The tiling below is made of triangles. You could remove some of the line segments to create a tiling of parallelograms, or remove still more to create a tiling of hexagons. In a tiling, a vertex is a point where the corners of the polygons fit together.
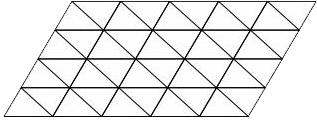
Transformation
A geometric operation that relates each point of a figure to an image point. Reflections, rotations, and translations—are symmetry transformations. A symmetry transformation produces an image that is identical in size and shape to the original figure.
Translation
A transformation that slides each point on a figure to an image point a given distance and direction from the original point. Polygon A′B′C′D′E′ below is the image of polygon ABCDE under a translation. If you drew line segments from two points to their respective image points, the segments would be parallel and they would have the same length.

Translational symmetry
A design has translational symmetry if you can slide it to a position in which it looks exactly the same as it did in its original position. To describe translational symmetry, you need to specify the distance and direction of the translation. Below is part of a design that extends infinitely in all directions. This design has translational symmetry.

Transversal
A line that intersects two or more lines. Lines s and t are transversals.
Trapezoid
A quadrilateral with exactly one pair of opposite sides parallel. This definition means that parallelograms are not trapezoids.

Tree diagram
A diagram used to determine the number of possible outcomes in a probability situation. The number of final branches is equal to the number of possible outcomes. The tree diagram below shows all the possible outcomes for randomly choosing a yellow or a red rose and then a white or a pink ribbon. The four possible outcomes are listed in the last column. Tree diagrams are handy to use when outcomes are equally likely.
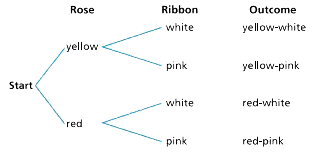
Trial
One round of an experiment. For example, if you are interested in the behavior of a coin, you might experiment by tossing a coin 50 times and recording the results. Each toss is a trial, so this experiment consists of 50 trials.
Triangular number
A number that gives the total number of dots in a triangular pattern. The first four triangular numbers are 1, 3, 6, and 10, the numbers of dots in Figures 1 through 4 below. The nth triangular number can be represented by the expression n(n+1)/2 The nth triangular number also represents the sum of the first n counting numbers.
 top
topU
Underestimate
To make an estimate that is slightly less than the actual value.
Unit cube
A cube whose edges are 1 unit long. It is the basic unit of measurement for volume.
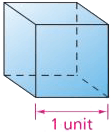
Unit fraction
A fraction with a numerator of 1. For example, in the unit 1/13, for the part-whole interpretation of fractions tells us that 13 indicated the number of equal-size parts into which the whole has been split and that the fraction represents the quantity of 1 of those parts.
Unit rate
A unit rate is a rate in which one of the numbers (usually written as the denominator) is 1, or 1 of a quantity. For example, 1.9 children per family, 32 miles per gallon, and 3 flavors of ice cream/1 banana split are unit rates. Unit rates are often found by scaling other rates.
Upper quartile
The median of the data to the right of the median (assuming the data are listed from least value to greatest value). For example, consider a data set with an odd number of items:
1, 2, 5, 6, 7, 8, 8, 10, 12, 15, 20
There are 11 items. The median of the data set is 8. (Six values are at or below 8 and six are at or above 8.) The median of the data to the right of the median (8, 10, 12, 15, and 20) is 12. The upper quartile is 12. Now consider a data set with an even number of items:
2, 3, 4, 5, 6, 6, 8, 8
There are eight items. The median of the data set is 5.5, the average of 5 and 6. The data items to the right of the median are 6, 6, 8, and 8. The median of these values is 7, the average of 6 and 8. The upper quartile is 7.
Use (Academic Vocabulary)
To draw upon given information to help you determine something else.
Related terms:
utilize, employ
Sample: Consider the following fractions and their decimal representations.
- 1/9 = 0.1111111...
- 2/9 = 0.2222222...
- 3/9 = 0.3333333...
Use the pattern you see to write decimal representations of 7/9 and 8/9.
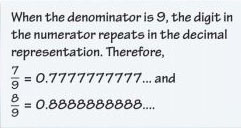 top
topV
Variability
An indication of how widely spread or closely clustered the data values are. Range, minimum and maximum values, and clusters in the distribution give some indication of variability. The variability of a distribution can also be measured by its IQR or MAD.
Variable
A quantity that can change. Letters are often used as symbols to represent variables in rules or equations that describe patterns.
Variance
Variance is calculated from the differences between the actual value and the mean. These differences are squared and averaged by dividing by (n – 1).
Venn diagram
A diagram in which overlapping circles are used to show relationships among sets of objects that have certain attributes. Two examples are shown below.
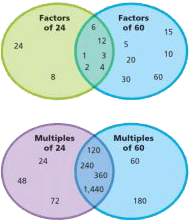
Vertex
A corner of a polygon. For example, G, H, I, J, and K are all vertices in the pentagon below. All angles have vertices: For example, in the hexagon below, angle AFE has a vertex at F.
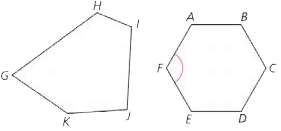
Vertex form
The vertex form of a quadratic function is f (x) = a(x – p)2 + q, where a ≠ 0 and (p, q) is the coordinate of the vertex of the function.
For example, f(x) = (x + 1)2 – 2 The vertex is (-1, -2).
Vertical angles
Vertical angles are a pair of congruent nonadjacent angles formed by the intersection of two lines. In the figure below, angles a and c are vertical angles, and angles b and d are vertical angles.
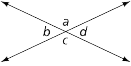
Volume
The amount of space occupied by a three-dimensional shape. The volume is the number of unit cubes that will fit into a three-dimensional shape.
Voluntary-response (or self-selected) sampling
A sample that selects itself. For example, if you put an ad in the school paper asking for volunteers to take a survey, the students who respond will be a voluntary-response sample.
topW
Width of a three-dimensional figure
See measurements of three-dimensional figures.
Width of a two-dimensional figure
See measurements of two-dimensional figures.
X
x-axis
The number line that is horizontal on a coordinate grid.
x-coordinate
See coordinates.
x-intercept
topY
The point where a graph crosses the x-axis. In the graph, the x-intercept is (-4, 0) or -4.
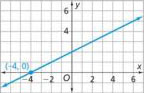
y-axis
The number line that is vertical on a coordinate grid.
y-coordinate
See coordinates.
y-intercept
The point where the graph crosses the y-axis. In a linear equation of the form y = mx + b, the y-intercept is the constant, b, In the graph above under x-intercept, the y-inctercept is (0, 2) or 2.
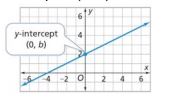 top
topZ
Zeros of a function
The values of x for which f(x) is equal to 0. For example, the zeros of the function f (x) = x2 – 9 are -3 and 3 because f(-3) = 0 and f(3) = 0. The zeros of a function are the x-intercepts of the graph of the function. The graph of f(x) = x2 – 9 has x-intercepts at (-3, 0) and (3, 0).
top