6.6 Variables and Patterns - Concepts and Explanations
Variables
A variable is a quantity that can change. Letters are often used as symbols to represent variables in rules that describe patterns.
Example
The number of students, n, who go on a trip is related to the price of the trip, p, for each student.
Patterns
A pattern is change that occurs in a predictable way. Students work on problems that require them to predict the pattern of change in values of one variable, as it relates to changes in values of another variable.
Example
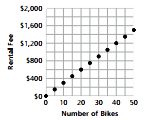
As the number of bikes increases by 1, the rental fee increases by $30.
Tables
A table is a list of values for two or more variables that shows the relationship between them. A table may show a pattern of change between two variables that can be used to predict values for other entries in the table.
The table shows how a change in one variable affects the change in the other variable.
Example
As the number of campsites, x, changes by one unit, the total campground fee, y, changes by 12.5 units. The table can be continued by adding 1 to the previous entry in the x row and adding $12.50 dollars to the previous entry in the y row.
| Number of campsites | 1 | 2 | 3 | 4 | 5 | 6 | 7 | 8 |
|---|---|---|---|---|---|---|---|---|
| Total campground fee | $12.50 | $25.00 | $37.50 | $50.00 | $62.50 | $75.00 | $87.50 | $100.00 |
Coordinate Graphs
A coordinate graph shows a representation of pairs of related numerical values. It relates the independent variable (shown on the x-axis) and the dependent variable (shown on the y-axis).
Graphs are another way to view the patterns of change between the variables.
Example
Discrete vs. Continuous Data
From a statistical perspective, there are two basic types of quantitative variables—those with only a countable set of values (discrete data) and those with real-number values (continuous data). Tables can only represent discrete collections of (x, y) values. Graphs can represent both but often suggest continuous variables.
Example
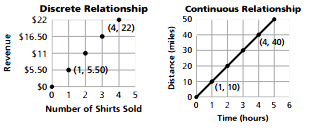
For the graph on the left, the number of shirts sold and revenue is a discrete relationship.
Connecting two points does not make sense. It would imply that part of a shirt could
be sold.
For the graph on the right, situations such as the distance/time/rate relation are
continuous. If a bicyclist peddles at a rate of 10 miles per hour, it is reasonable
to connect the points, because you can go a distance in part of an hour.
Rules and Equations
Rules are a summary of a predictable relationship that tells how to find the values of a variable. A rule may be given in words or as an equation. Equations (or formulas) are rules containing variables
The advantage of a symbolic rule is that it is brief and represents a complete picture of the pattern, while tables and graphs can represent only parts of the relationships.
Example
These rules relate time, rate, and distance: distance is equal to rate times time d = rt
Rule (in words): Total profit equals profit per T-shirt times the number of shirts sold.
Rule (written as an Equation): y = 10x
A formula or equation for finding the area of a circle: A = Πr2