6-7 Data About Us - Concepts and Explanations
Representing Data Distributions
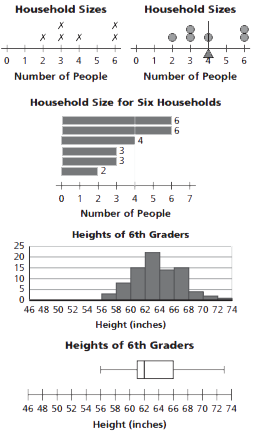
Statisticians use data displays or statistics to analyze information. Examples of data displays are shown below.
Line Plot: Each case is represented by an "X" positioned over a labeled number line.
Dot Plot: Each case is represented by a "o" positioned over a labeled number line.
Ordered-Value Bar Graph: A bar's height is the value of an individual case. Each case is represented by one bar. The bars may be displayed horizontally or vertically and may be ordered by magnitude of data values.
Histogram: Numerical data is displayed using intervals. The vertical axis shows the frequency in either numbers or percents; the height of each bar indicates the count or percent of data values for that interval. The bars touch to depict the continuity of the number line.
Box-and-Whisker Plot, or Box Plot: Data is divided into quarters, or quartiles. The first and fourth quartiles are the whiskers, while the box surrounds the second and third quartiles.
Example
Reading Standard Data Representations
To read the data, you find information to answer explicit questions. To read between the data, you interpret and integrate information. To read beyond the data, you extend, predict, or infer to answer questions.
Example
In the household data, the least number of people in a household is two. Five households have more than two people in them. The typical household has four people in it.
Measures of Center
Mode: The data value that occurs most frequently.
Median: The midpoint of an ordered set of data.
Mean: The value found when all the data are combined and then redistributed evenly.
Example
For the data set 0, 0, 1, 1, 2, 2, 2, 2, 3, 5, the mode is 2, the median is 2, and the mean is 1.8.
Measures of Spread/Variability
Range: The maximum value - the minimum value.
Interquartile Range (IQR):The range of the middle 50% of the data values.
Mean Absolute Deviation (MAD): A measure of how close or spread out the data values are, on average, from the mean.
Example
For the data set 0, 0, 1, 1, 2, 2, 2, 2, 3, 5, the range is 5, the IQR is 1, and the MAD is 1.04.
Types of Data
Numerical data: Counts, measurements, or ratings.
Categorical data: Words or responses within categories.
Example
Pulse, height, time spent watching TV favorite color, month of birth, types of pets owned.