7-6 What Do You Expect? - Concepts and Explanations
Probability
A number from 0 to 1 that describes the likelihood that an event will occur.
Example
If a bag contains a red marble, a white marble, and a blue marble, then the probability of drawing a red marble is 1 out of 3 or 1/3. We would write: P(red) = 1/3.
Theoretical Probability
A probability obtained by analyzing a situation. If all the outcomes (possible results) are equally likely, theoretical probability is the ratio of the number of outcomes you are interested in to the total number of outcomes.
If a number cube has six sides with the possible outcomes of rolling 1, 2, 3, 4, 5, or 6, then the probability of rolling a 3 is 1 out of 6.
P(Rolling a 3) = ![]()
Experimental Probability
A probability found as a result of an experiment. This probability is the relative frequency of the event (a set of outcomes)—that is, the ratio of the number of times the event occurred compared to the total number of trials (one round of an experiment). Experimental probabilities are used to predict behavior over the long run.
Example
You could find the experimental probability of getting a head (H) when you toss a coin by tossing the coin several times and keeping track of the outcomes. If you tossed a coin 50 times and heads occurred 23 times, the relative frequency of heads would be 23/50.
![]()
Random Events
In mathematics, random means that any particular outcome is unpredictable, but the long-term behavior exhibits a pattern.
Example
When you roll a number cube, the number that will result is uncertain on any one particular roll, but over a great many rolls, each number will occur about the same number of times.
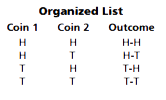
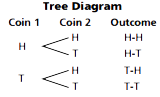
Strategies for Finding Outcomes
When situations involve more than one action, we need to generate the outcomes in a systematic way. An organized list or tree diagram is particularly useful.
Example
Area Model
A diagram in which fractions of the area corresponding to probabilities in a situation.
Area models are particularly helpful when the outcomes being analyzed are not equally likely, and larger areas can represent the more likely outcomes. Area models are also most helpful for outcomes involving more than one stage, such as roll a die and then flip a coin.
Example
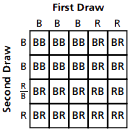
If there are three blue blocks and two red blocks in a container and one block is drawn out at a time, without replacing the block drawn each time, the area model at the right shows that the probability of getting two red blocks is 2/20 or 1/10
Expected Value or Long-Term Average
The average payoff over many trials.
Example
A game is played with two number cubes. You score 2 points when a sum of 6 is rolled, 1 point for a sum of 3, and 0 points for anything else. If you roll the cubes 36 times, you could expect to get a sum of 6 about five times and a sum of 3 about twice. This means that you could expect to score (5 X 2) + (2 X 1) = 12 points for 36 rolls, an average of 12/36 = 1/3 point per roll. This is the expected value (or long-term average) of one roll.
Law of Large Numbers
Experimental data gathered over many trials should produce probabilities that are close to the theoretical probabilities.
Example
For 1 million flips, exactly 50% heads is improbable. But for 1 million flips, it would be extremely unlikely for the percent of heads to be less than 49% or more than 51%.