7-8 Samples and Populations - Concepts and Explanations
The Process of Statistical Investigation
This process involves posing questions, collecting data, analyzing distributions, and interpreting analysis in light of the questions. It also involves considering whether to collect new data or use existing data. Finally, the results are communicated.
Example
Students refine their ideas about asking questions and collecting data. The questions must be clear, and the samples of data must be unbiased. For example, if a survey asks about the number of movies watched during a particular time frame, the definition of “movie” must be clarified. Also, if the sample is intended to be representative of a greater population, it must be free of bias. The method of collecting data, therefore, is important.
Exploring the Concept of Sampling
Sampling is used to draw conclusions about a whole population by analyzing only a part of it. Collecting data on the entire population may be difficult because of cost or the size of the population. Statisticians try to obtain a representative sample by selecting the sample at random. Sample size is also important.
Example
A random sample is one in which every member of a population is equally likely to be chosen. A representative sample is one whose characteristics accurately reflect those of the larger population. For example, when determining the typical number of movies students watch, you can number each student in the population and then choose numbers at random. Sampling methods that are not random, such as surveying a movie club, are less likely to be representative.
Making Sense of Data with Data Objects
Statisticians use representations or statistics to analyze data. This involves displaying data, reading graphs, and calculating measures of central tendency and measures of spread.
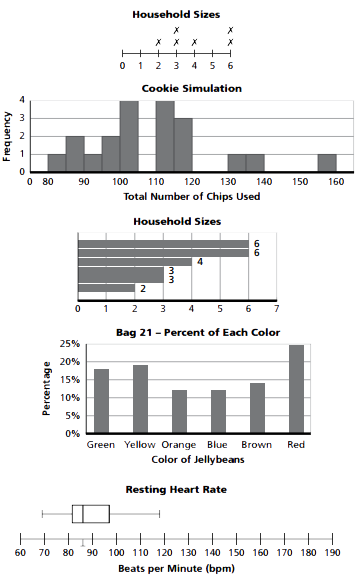
Line Plots (Dot Plots): Each item is represented by an "x" (or a dot) above a number line.
Histogram: The size of the bar over each interval shows the frequency of data values in that interval; frequencies may be displayed as counts or percentages.
Ordered-Value Bar Graph: Each case is represented by a separate bar. The length of each bar corresponds to the magnitude or value of the case. The bars are ordered from least to greatest or greatest to least.
Frequency Bar Graph: A bar’s height is not the value of an individual case, but rather the number (frequency) of cases that have that value.
Box-and-Whisker Plot: Box plots group data into quartiles to make the data easier to analyze or to compare with other sets of data. They display symmetry or skewness of data.
Example