8-1 Thinking with Mathematical Models - Concepts and Explanations
Mathematical Model
An equation or a graph that describes the relationship between two variables. A mathematical model is made by graphing data and finding an equation or a curve to approximate it. A model lets you estimate values between and beyond the data points.
Example
Students model bridge thickness and strength data by:
- simulating the strength of bridges that have various layers of thickness and collecting data,
- plotting the data and drawing a line of best fit,
- finding an equation to model the data (e.g., y = 8x),
- and using the equation to predict the breaking weights for other bridges. For example, using y = 8x, a bridge of thickness 3.5 layers can hold a load of 28 pennies.
Linear Relationships and Functions
Students have learned how to recognize, represent, and analyze linear relationships. They have learned how to solve linear equations. Students will deepen these understandings in this Unit.
Example
In the equation y = mx + b, m indicates the constant ratio change in y/change in x, which is the slope of the graph. The variable b indicates the y intercept (0, b) of the graph. Students solve linear equations by
- approximating (x, y) values in tables and graphs,
- undoing the operations involved in linear function calculations by using the properties of equality, and
- looking at the associated fact family equations.
Direct Variation
Models that can be written in the form y = kx.
Example
Students are familiar with direct variation as a special case of a linear function (that is, those with a y-intercept of zero).
Inverse Variation
Models that can be written in the form y = k/x. The key learning goals for students are first, that an indirect variation gives a nonlinear pattern of change and second, that its equation can be written in the form y = k/x.
Example
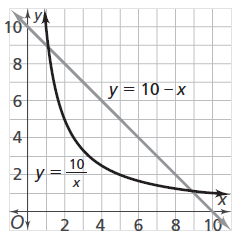
The contrasting graphs of y = 10 - x (line) and y = 10/x (curve) demonstrate that dividing by an increasing variable has a different effect than subtracting an increasing variable does.
Students are familiar with the formula A = lw for finding the area of a rectangle with given length and width. Now, students are asked to look for combinations of length and width that give a fixed area. This leads to the formula l = A/w.
Patterns of Association in Numerical Data
Example
Scatter plots can be used to model association between two quantities. Students describe patterns such as clustering, outliers, positive/negative association, and linear/nonlinear association. For linear data, students write a linear model and assess the fit of the model by judging the closeness of the data points to the line.
Patterns of Association in Categorical Data
Example
Students construct and interpret two-way tables of categorical data and use relative frequencies calculated for rows or columns to describe the association between the two variables. In the two-way table below, students look for an association between gender and political party affiliation.
| Democrat | Independent | Republican | |
|---|---|---|---|
| Boys | 8 | 4 | 12 |
| Girls | 8 | 2 | 6 |