8-4 Frogs, Fleas, and Painted Cubes - Concepts and Explanations
Representing Quadratic Patterns of Change with Tables
In linear functions, the first differences of successive values are constant, indicating a constant rate of change. In quadratic functions, first differences are not constant, but second differences are. The first difference is the rate at which y is changing with respect to x. That is, the first difference gives the change in y-values between x and x + 1. The second difference indicates the rate at which that rate is changing. If the second differences are all the same, then the function is quadratic. Finding successive differences of polynomials relates to derivatives in calculus.
Example
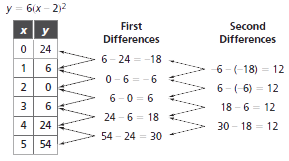
The second differences are all 12, which indicates that the table represents a quadratic function.
Representing Quadratic Functions With Equations
Traditionally, quadratic functions are defined as functions that have equations fitting the form y = ax2 + bx + c, in which a, b, and c are constants, and a ≠ 0. This form of the equation is called the expanded form. The emphasis is on observing that the equations contain an independent variable raised to the second power. While this is a useful definition, it is also important to understand the factored form of such equations.
Quadratic equations arise from situations that have an underlying multiplicative structure, such as the area of rectangles. Thus, many quadratic equations can also be defined as functions whose y-value is equal to the product of two linear factors—the form y = (ax + c)(bx + d), where a ≠ 0 and b ≠ 0. The power of this form is that it ties polynomials together as products of linear factors. The two factors for the factored form of a quadratic expression are also called binomial expressions, or binomials. It is an expression with two terms.
Example
The area of the rectangle below can be thought of as the product of two linear expressions, the result of multiplying the width by the length, or as the sum of the area of the subparts of the rectangle.
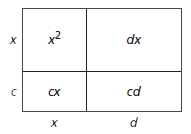
A = (x + c)(x + d) factored form
A = x2 + cx + dx + d expanded form
Representing Quadratic Patterns of Change With Graphs
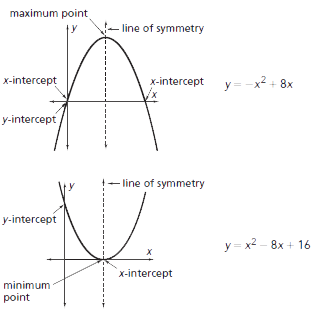
The values in the equation affect the shape, orientation, and location of the quadratic graph, a parabolic curve.
If the coefficient of the x2 term is positive, the curve opens upward and has a minimum point. If negative, the curve opens downward and has a maximum point.
The maximum or minimum point of a quadratic graph (parabola) is called the vertex. The vertex lies on the vertical line of symmetry that separates the parabola into halves that are mirror images. The vertex is located halfway between the x-intercepts, if the x-intercepts exist. The x-intercepts are mirror images of each other. The y-intercept is the point at which the parabola crosses the y-axis.
Example