Walking to Win (Second Lesson)
Linear Relationships
For CMP2, Problem 2.1 Walking to Win (Day 2 of the Lesson)
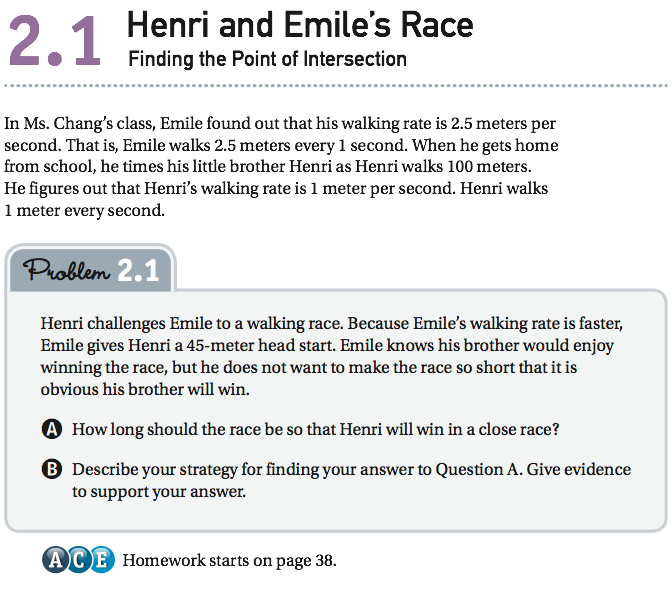
For CMP3, Problem 2.1 Henri and Emile's Race
This video captures strategies for creating and soliving alternatives to Problem 2.1. This presents an opportunity to observe a teacher following up on a student suggestion by analyzing what students understand or do not understand, and assessing their mathematical development in terms of the goals of Investigation 2.
The video concludes with the teacher reflecting her planning and the decisions she made during the lesson.
Real time is 1.5 class periods.
As you view the video, consider the following:
- What is the evidence of students’ understanding and reasoning? What prior understandings do you see students using or building upon?
- What is the evidence of students’ use of the mathematical practices from the Common Core State Standards? To what extent are students growing in their sophistication of their use of the practices?
- Were there any “aha moments” in the video?
- How is the teacher facilitating the development of students’ understanding and reasoning?
- As a teacher, how would you use the information from this lesson to plan the next lesson?
- Full Length Video (32:34)
- CMP2 Problem 2.1
- CMP3 Problem 2.1
- CMP2 Goals for Investigation 2
- Find solutions to a problem using a table or graph
- Understand the connections between linear equations and patterns in the tables and graphs of those relations, including rate of change, and the x- and y-intercepts
- Translate information about linear relations given in a table, a graph, or an equation to one of the other forms
- Connect solutions in graphs and tables to solutions of equations
- Write equations for linear relationships and describe what information the variables and numbers represent
- CMP3 Goals for Investigation 2
- Linear Relationships Recognize problem situations in which two variables have a linear
relationship.
- Identify and describe the patterns of change between the independent and dependent variables for linear relationships represented by tables, graphs, equations, or contextual settings
- Construct tables, graphs, and symbolic equations taht represent linear relationships
- Identify the rate of change between two variables and the x- and y-intercepts from graphs, tables, and equations that represent linear relationships.
- Translate information about linear relationships given in a contextual setting, a table, a graph, or an equation to one of the other forms
- Write equations that represent linear relationships given specific pieces of information, and describe what information the variables and numbers represent
- Make a connection between slope as a ratio of vertical distance to horizontal distance between two points on a line and the rate of change between two variables that have a linear relationship
- Recognize that y = mx represents a proportional relationship
- Solve problems and make decisions about linear relationships using information given in tables, graphs, and equations
- Equivalence Understand that the equality sign indicates that two expressions are equivlent.
- Recognize that the equation y = mx + b represents a linear relationship and means that mx + b b is an expression equivalent to y
- Recognize that linear equations is one unknown, k = mx + b or y = m(t) + b/e>, where k,t,m and b are constants, area special cases of the equation y = mx + b
- Recognize that finding the missing value of one of the variables in a linear relationship, y = mx + b, is the same as finding a missing coordinate of a point (x, y) that lies on the graph of a relationship
- Linear Relationships Recognize problem situations in which two variables have a linear
relationship.
- Video Transcript
- Suggestions for organizing Professional Development
- Student Work