CMP2 Grade 7
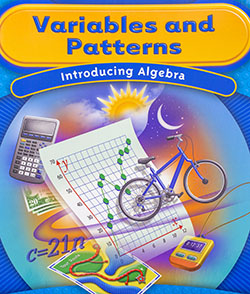 Variables and Patterns
Main Ideas | Worked Homework Examples
In Variables and Patterns, students will study some basic ideas of algebra and some ways to use those ideas to solve problems about variables and patterns relating variables. In particular, they will learn how to:
- Identify quantitative variables in situations;
- Recognize situations where changes in variables are related in useful patterns;
- Describe patterns of change shown in words, tables and graphs of data;
- Construct tables and graphs to display relations among variables;
- Observe relationships between two quantitative variables as shown in a table, graph, or equation and describe how the relationship can be seen in each of the other forms of representation;
- Use algebraic symbols to write rules and equations relating variables;
- Use tables, graphs, and equations to solve problems; and Use graphing calculators to construct tables and graphs of relations between variables and to answer questions about these relations.
 Stretching and Shrinking
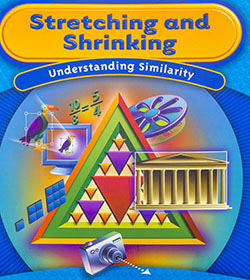
Main Ideas | Worked Homework Examples
In Stretching and Shrinking students learn the mathematical meaning of similarity and explore the properties of similar figures. The investigations in this unit will help students:
- Identify similar figures by comparing corresponding parts;
- Use scale factors and ratios to describe relationships among the side lengths of similar figures;
- Construct similar polygons;
- Draw shapes on coordinate grids and then use coordinate rules to stretch and shrink those shapes;
- Predict the ways that stretching or shrinking a figure affect lengths, angle measures, perimeters, and areas;
- Use the properties of similarity to calculate distances and heights that can't be directly measured.
 Comparing and Scaling
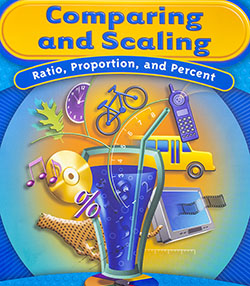
Main Ideas | Worked Homework Examples
In Comparing and Scaling students will learn how to:
- Analyze comparison statements made about quantitative data
- Use ratios, fractions, differences, and percents to form comparison statements in a given situation, such as "What is the ratio of boys to girls in our class?", "What fraction of the class is going to the spring picnic?", "What percent of the girls play basketball?", "Which model of car has the best fuel economy?", "Which long-distance telephone company is more popular?"
- Judge whether comparison statements make sense and are useful
- See how forms of comparison statements are related, for example, a percent and a fraction comparison
- Make judgments about which statements are most informative or best reflect a particular point of view
- Decide when the most informative comparison is to find the difference between two quantities and when it is to form ratios between pairs of quantities
- Scale a ratio, rate, or fraction up or down to make a larger or smaller object or population with the same relative characteristics as the original
- Represent related data in tables
- Look for patterns in tables that will allow predictions to be made beyond the tables
- Write an equation to represent the pattern in a table of related variables
- Apply proportional reasoning to solve for the unknown part when one part of two equal ratios is unknown
- Set up and solve proportions that arise in applications
- Recognize that constant growth in a table is related to proportional situations
- Connect unit rates with the equation describing a situation
 Accentuate the Negative
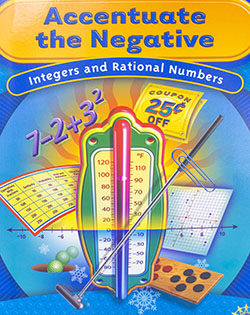
Main Ideas | Worked Homework Examples
In Accentuate the Negative students learn to:
- Use appropriate notation to indicate positive and negative numbers;
- Compare and order rational numbers (positive and negative fractions and decimals and zero) and locate them on a number line;
- Understand the relationship between a positive or negative number and its opposite (additive inverse);
- Develop algorithms for adding, subtracting, multiplying, and dividing positive and negative numbers and write mathematical sentences to show relationships;
- Write and use related fact families for addition and subtraction and multiplication and division to solve simple equations with missing facts;
- Use parentheses and order of operations conventions to make computational sequences clear
- Understand and use the commutative property for addition and multiplication of negative and positive numbers;
- Apply the distributive property with positive and negative numbers to simplify expressions and solve problems;
- Use positive and negative numbers to graph in four quadrants, model and answer questions about applied settings.
 Moving Straight Ahead
Main Ideas | Worked Homework Examples
In Moving Straight Ahead, students will study some basic ideas of algebra and some ways to use those ideas to solve problems involving linear relationships and linear functions. In particular, they will learn how to:
- Recognize problem situations in which two variables have a linear relationship to each other;
- Describe the patterns of change between the independent and dependent variables for linear relationships that are represented in tables, graphs or equations;
- Construct tables, graphs, and symbolic equations that express linear relationships;
- Translate information about linear relations given in a table, a graph, or an equation to one of the other forms;
- Understand the connections between linear equations and patterns in the tables and graphs of those relations-rate of change, slope, and y-intercept;
- Solve linear equations, using tables, graphs and symbolic expressions;
- Connect solutions of equations to graphs and tables and vice versa;
- Describe the information the variables and numbers in an equation represent;
- Solve problems and make decisions about linear relationships using information given in tables, graphs, and symbolic expressions.
 Filling and Wrapping
Main Ideas | Worked Homework Examples
In Filling and Wrapping students explore surface area and volume of objects, especially rectangular prisms, cylinders, cones, and spheres and learn to:
- Understand volume as a measure of filling an object and surface area as a measure of wrapping an object;
- Use flat patterns to visualize and calculate surface areas of prisms and cylinders;
- Develop formulas for the volumes of prisms, cylinders, cones and spheres directly and by comparison with known volumes;
- Understand that three-dimensional figures may have the same volume but quite different surface areas;
- Use surface area and volume to solve a variety of real-world problems;
- Understand how changes in one or more dimensions of a rectangular prism or cylinder affects the prism's volume;
- Extend students' understanding of similarity and scale factors to three-dimensional figures;
- Understand the effect on surface area and volume of applying a scale factor to a rectangular prism.
 What Do You Expect?
Main Ideas | Worked Homework Examples
In What Do You Expect students learn to:
- Interpret experimental and theoretical probabilities and the relationship between them;
- Distinguish between equally likely and non-equally likely outcomes;
- Review strategies for identifying possible outcomes and analyzing probabilities, such as using lists or counting trees;
- Determine if a game is fair or unfair;
- Analyze probabilistic situations that involve two-stages (or two actions);
- Use area models to analyze situations that involve two stages;
- Determine the expected value of a probability situation;
- Analyze binomial situations;
- Use probability and expected value to make decisions.
 Data Distributions
Main Ideas | Worked Homework Examples
Recognize that variability occurs whenever data are collected and describe the variability in the distribution of a given data set:
- Identify sources of variability, including variability that occurs naturally in data and variability that results from errors in measurement;
- Understand and decide when to use the mean or median to describe a distribution;
- Use the shape of a distribution to help estimate locations of the mean and median;
- Make effective use of a variety of representations to display distributions, including tables, value bar graphs, dot plots or line plots and frequency bar graphs;
- Understand and use counts or percents to report frequencies of occurrence of data;
- Compare the distributions of data sets using their centers (mean, median, and mode), spreads (outliers, and range) and shape(clusters, gaps);
- Decide if a difference among data values and/or summary measures matters;
- Develop and use strategies to compare equal-size and unequal-size data sets to solve problems.
Data Around Us (CMP1)
The unit Data Around Us was developed to help students build number sense and to:
- Choose sensible units for measuring
- Understand that measurement has two components, a unit of measure and a count
- Build a repertoire of bench marks to relate the measures of unfamiliar objects or events to the measures of objects or events that are personally meaningful
- Review the concept of place value as it relates to reading, writing, and using large numbers
- Read, write, and interpret large numbers that occur in everyday measurements using standards, scientific, and calculator notation
- Choose sensible ways of comparing counts and measurements, including using differences, rates, and ratios
- Use estimates and rounded numbers for describing and comparing quantities